
Free interactive tool
Expected Lottery Frequency Calculator
Compare one specified label’s observed count with the mean and spread predicted by a binomial model.
Inputs and results stay in this page. These tools set no cookies, save no browser preferences and send no input data to our server. A CSV downloads only when you request it. Displayed probabilities are rounded; combination counts use exact integer arithmetic.
Understand the result
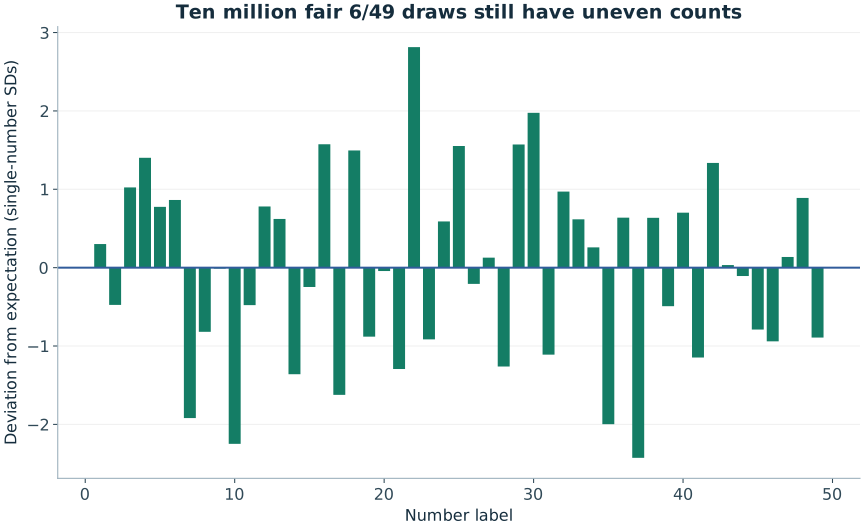
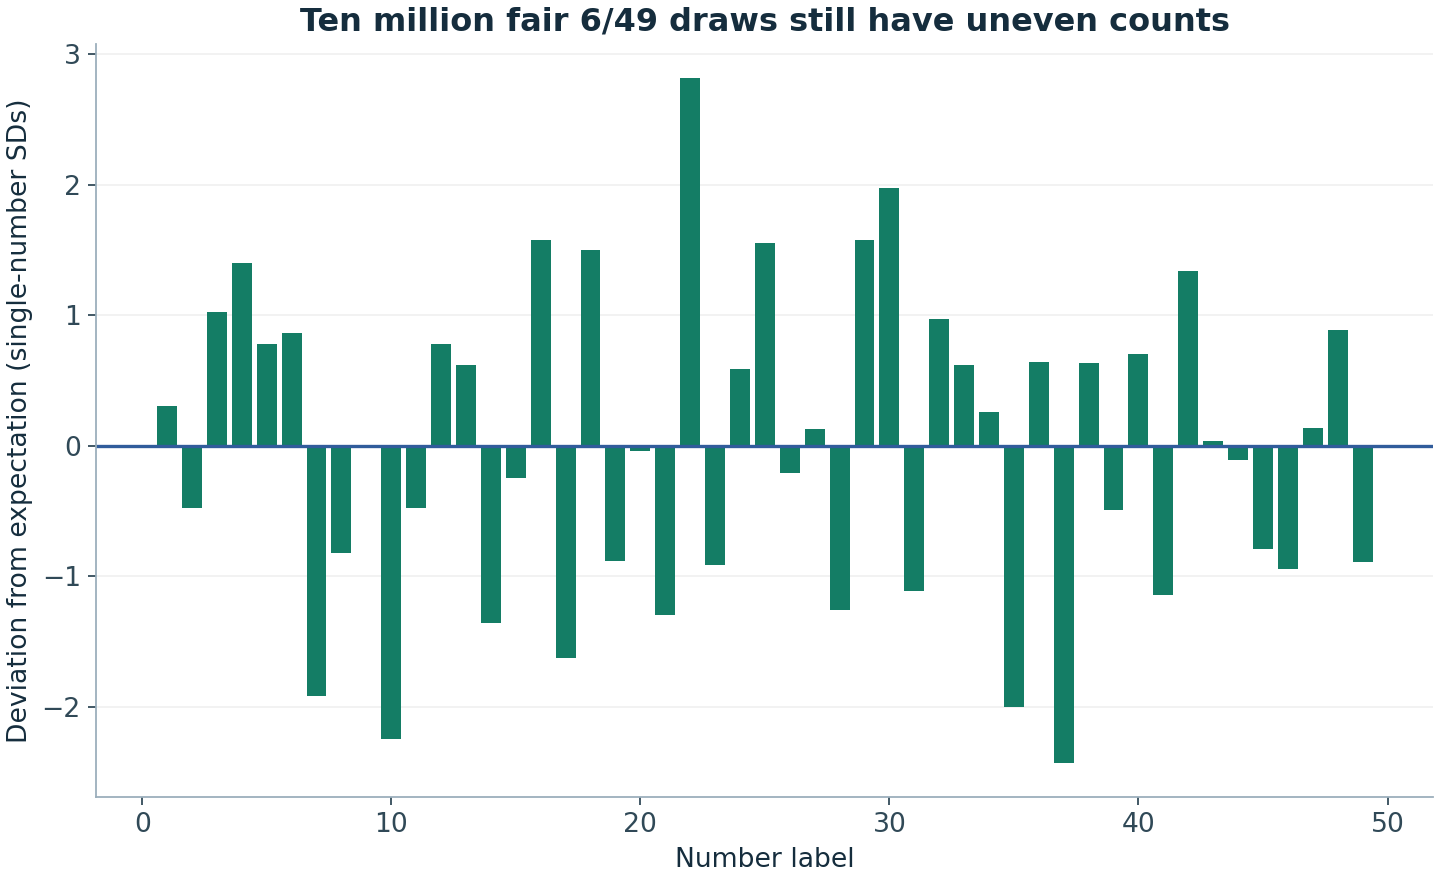
Expected vs Observed Lottery Frequencies: Reading a Table Properly explains the derivation and common interpretation errors. Compare it with the published Ten million 6/49 draws: how uneven does fair look?.
Related game generators
Generate a valid line for a game without treating this calculation as a prediction.