
RoomForChance Lab
Don’t just trust the claim.
Inspect the experiment.
Eleven original studies with executed results, explicit models and reproducible code. Every chart tells you what was measured—and what was not.
These are synthetic model studies, not historical lottery results. Use the exact benchmarks to understand the model, the data to inspect its variation and the source code to reproduce the run.
Experiment 01
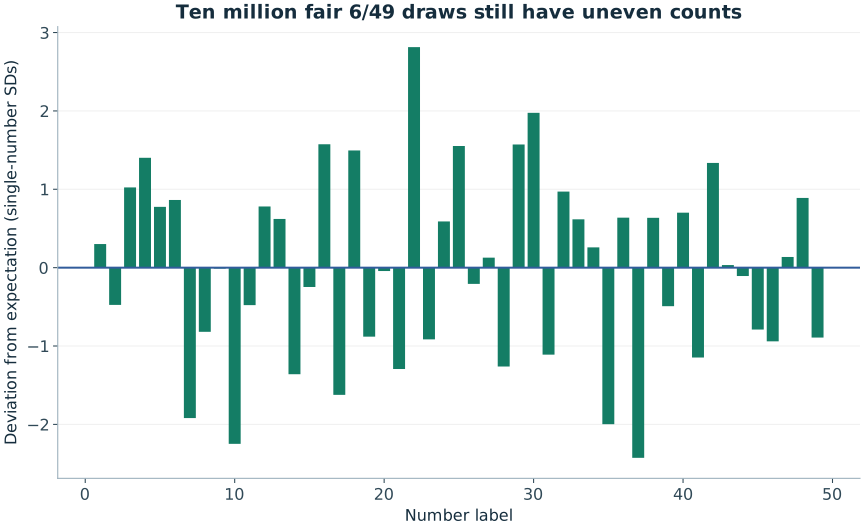
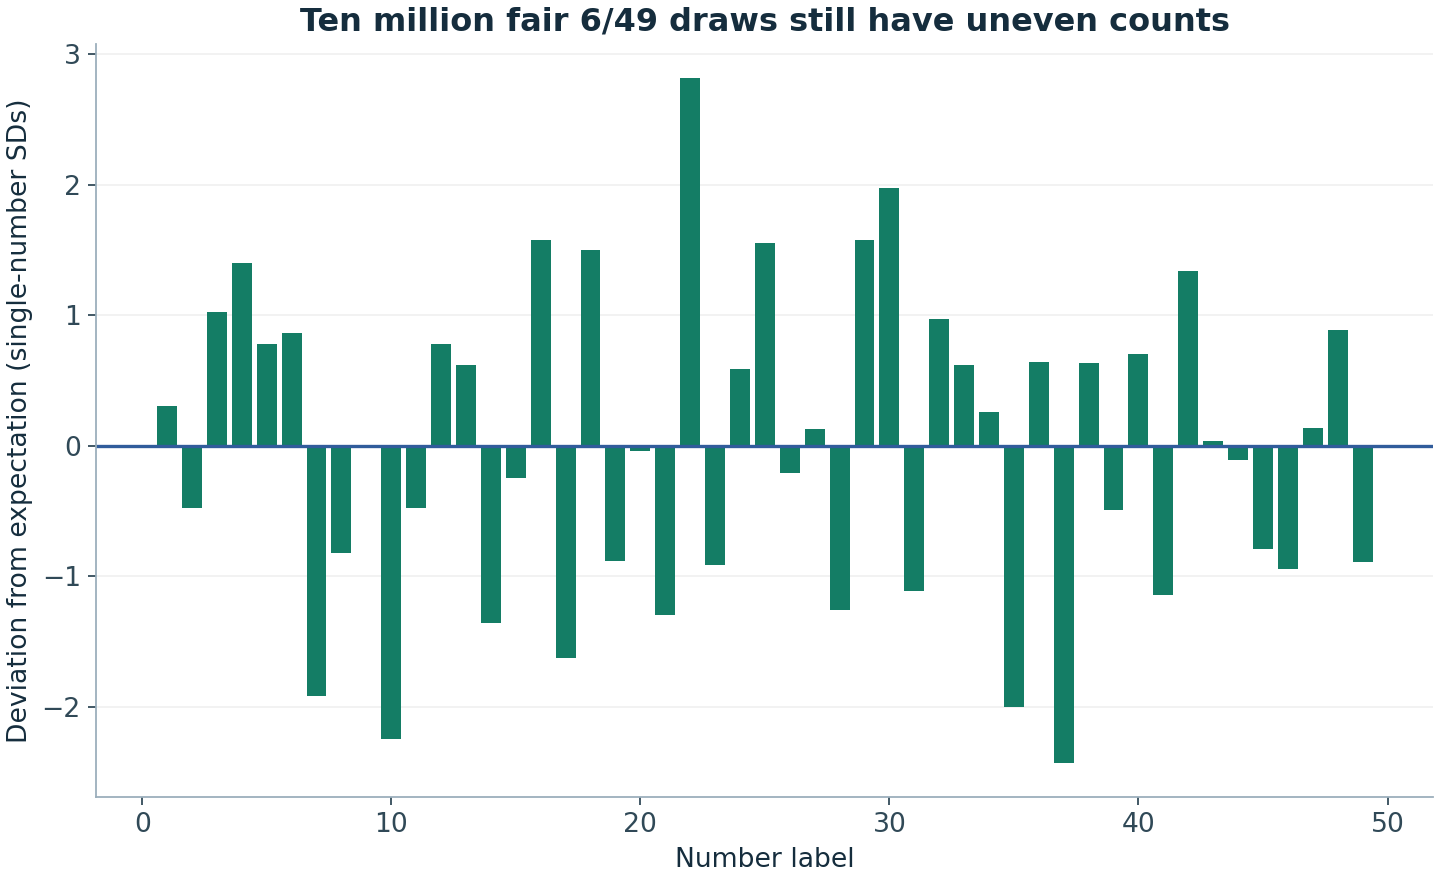
Ten million 6/49 draws: how uneven does fair look?
10,000,000 independent uniform six-number subsets of 1–49.
Results · Method · Data · CodeExperiment 02
Hot, cold and random: a genuinely held-out experiment
In each independent trial, rank 49 numbers in 100 training draws, break frequency ties randomly, then freeze three six-number sets and evaluate on 20 fresh draws.
Results · Method · Data · CodeExperiment 03
1-2-3 versus 2-6-9: exact enumeration and one million draws
Enumerate C(10,3)=120 subsets exactly, then sample 1,000,000 uniform 3/10 draws.
Results · Method · Data · CodeExperiment 04
How long can one number stay absent? A million complete waits
Draw one million independent geometric waiting times for a prespecified number with inclusion probability 6/49.
Results · Method · Data · CodeExperiment 05
Consecutive numbers: the exact answer meets a million draws
Count adjacent differences equal to one in each sorted 6/49 draw.
Results · Method · Data · CodeExperiment 06
Two fresh draws, one million times: how many numbers repeat?
Generate one million independent pairs of 6/49 draws.
Results · Method · Data · CodeExperiment 07
Balanced groups, equal tickets: the odd–even experiment
Group one million uniform 6/49 draws by odd count.
Results · Method · Data · CodeExperiment 08
Why any repeat arrives sooner than one chosen repeat
Run 10,000 independent sequences on 10,000 equally likely outcomes, stopping at the first repeated outcome.
Results · Method · Data · CodeExperiment 09
Twenty chances to be fooled: a false-positive experiment
Model 20 independent tests with exactly calibrated 5% false-positive rates as Bernoulli indicators, repeated 100,000 times.
Results · Method · Data · CodeExperiment 10
Closer in proportion, further in count: the law of large numbers
Generate 20,000 independent binomial counts at each sample size.
Results · Method · Data · CodeExperiment 11
An eight-bit die exposes modulo bias
Map one million uniform bytes to six faces with modulo; separately generate one million accepted faces by rejecting bytes 252–255.
Results · Method · Data · Code