
What happened
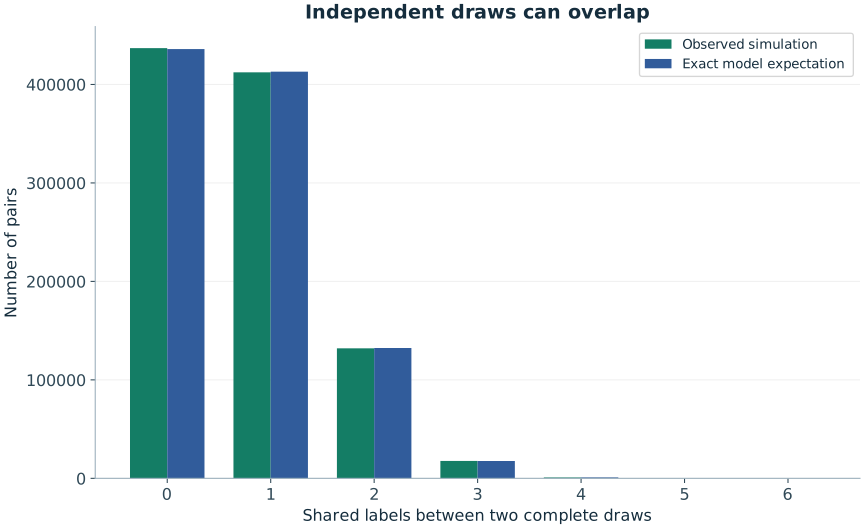
The observed mean intersection size was 0.733503 labels, compared with the exact expectation 36/49 ≈ 0.734693878.
Shared labels do not contradict independence. After the first draw is fixed, each of its six labels has a 6/49 chance of returning in the second. Adding these inclusion probabilities gives the expected overlap without assuming independence among labels within a draw.
Method and benchmark
Generate one million independent pairs of 6/49 draws. Count the size of their intersection. Pairing disjoint draws makes the experimental trials independent.
The experiment generates disjoint independent pairs. Exactly r shared labels has probability C(6,r)C(43,6−r)/C(49,6). The reference counts in the CSV are one million times those exact probabilities.
Python 3.12.14 · NumPy 2.3.5 · NumPy PCG64 · seed 20260928. Each experiment starts a separate stream. Code and all datasets are linked below.
What this does not establish
This measures shared numbers, not identical ordered extraction sequences. The full-repeat category is too rare for stable relative precision at this sample size.
Every category is retained, including a complete repeat. A million pairs are too few for stable relative precision in that extremely rare category. A zero observed count would therefore not mean the event has zero probability or contradict the exact model.
These are original educational simulations prepared for RoomForChance. They are not historical lottery records, a physical-machine audit, an external peer review or evidence of a prediction advantage.
Inspect the data
Download overlap-between-draws.csv · All results and metadata (JSON) · Download the complete Python program · Download figure-generation code
| matches | observed | expected |
|---|---|---|
| 0 | 436,916 | 435,964.976 |
| 1 | 412,328 | 413,019.45 |
| 2 | 132,066 | 132,378.029 |
| 3 | 17,732 | 17,650.4039 |
| 4 | 943 | 968.619724 |
| 5 | 15 | 18.4498995 |
| 6 | 0 | 0.0715112384 |
Reproduce the experiment
Download the Python program to an empty working folder. Use the recorded environment for an exact replay. The program runs all eleven studies and creates a lab-data folder containing the result files. The largest study performs ten million draws; allow time for it to finish.
python -m pip install numpy==2.3.5
python run_experiments.py
Expected CSV SHA-256: 499e625a3230b820997c1d04b5f7cca47d2fe33b38769e5cafc5a1cde9698969. A matching seed alone is insufficient if you change the implementation or call sequence. The CSV files use CC BY 4.0; the original code uses the MIT license included with the downloads.
Read the reasoning
How Bonus Balls and Separate Number Pools Change Lottery Odds
Separate special-ball pools and bonus balls drawn from the main pool need different formulas. Learn the distinction with worked examples.
Can Lottery Numbers Repeat? Three Different Questions
Repeated balls, repeated numbers across draws and repeated complete combinations follow different probability rules. See the exact distinctions.
How Often Do Lottery Numbers Repeat Between Draws?
Use the hypergeometric distribution to calculate shared labels between independent draws, including zero overlap and four repeated numbers.
EuroMillions Odds: Five Numbers, Two Lucky Stars and 139,838,160 Outcomes
Derive EuroMillions match probabilities, including five main numbers with no Lucky Stars, and keep raffle codes separate from the number matrix.
How to Calculate the Probability of Matching Lottery Numbers
Derive the hypergeometric formula for exactly r matches and distinguish exact, at-least and separate-pool matching events.
Thunderball Odds Explained: 8,060,598 Complete Combinations
Calculate Thunderball’s 5/39 + 1/14 outcome space and learn why the special-ball pool affects partial-match categories.
Technical references
NumPy PCG64 documentation describes the generator family. Harvard Stat 110 provides university-level probability background. The model-specific derivation is linked above.