
For a fixed k-number ticket and a uniform draw of k distinct labels from n, the probability of exactly r matches is C(k,r)C(n−k,k−r)/C(n,k). The formula is a counting argument: choose the matches from your ticket, choose the misses from outside it, and divide by all possible draws.
Understanding those two choices is more useful than memorising the name “hypergeometric distribution”. It also makes the formula easier to adapt without accidentally changing the event.
Build one example from the ground up Your generic 6/49 line contains six labels. Exactly three matches require choosing three of those six labels, giving C(6,3) possibilities. The other three drawn labels must come from the 43 you did not select, giving C(43,3). Multiply those counts because each choice of matches can pair with each choice of misses.
The denominator is C(49,6). There is no further multiplication by the number of orders: both numerator and denominator already count unordered sets. Adding an order factor to only one side would introduce an error.
Exactly three is not at least three “At least three” includes three, four, five and six matches. Add the four exact probabilities. “Three or fewer” includes zero through three. The conditions partition the outcome space, so the exact probabilities from zero to six sum to one.
This sum is a useful calculator check. Another check is the expected match count: k²/n when the ticket and draw each contain k labels. For 6/49 it is 36/49. A distribution that fails either check is not implementing the intended model.
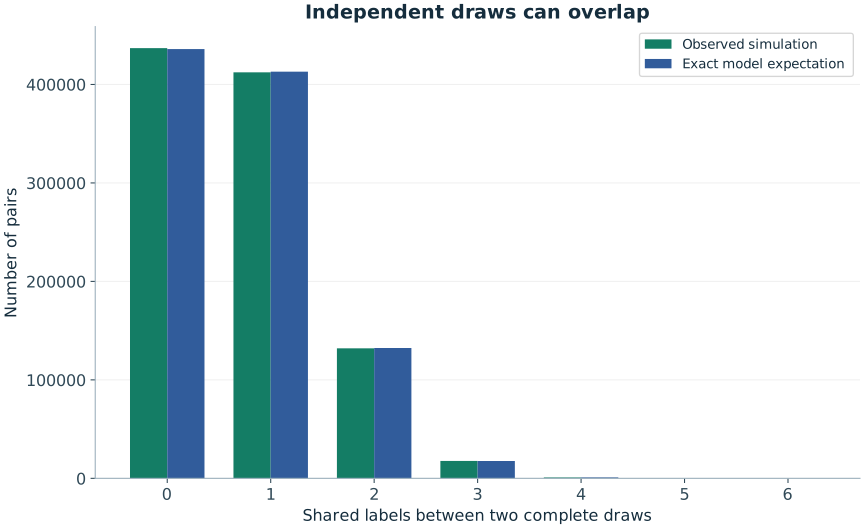
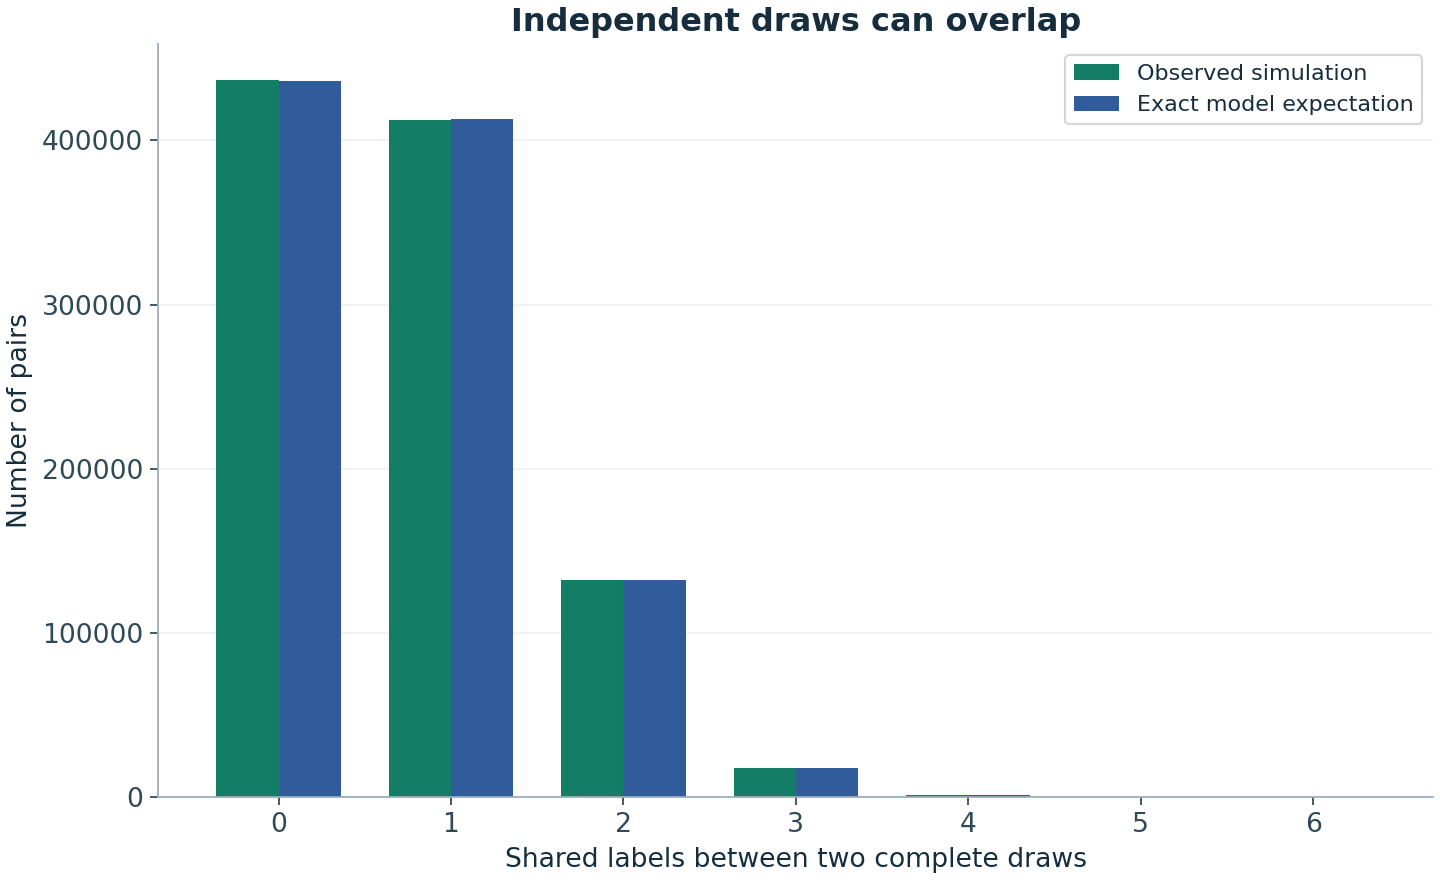
The formula is not six independent coin tosses The balls are drawn without replacement. After a matching ball is selected, there is one fewer matching label and one fewer total label left. A binomial model with a fixed matching probability at each ball position would ignore that dependence.
The hypergeometric count handles it directly by selecting whole sets. That is why the same expression also describes overlap between two independent complete draws: once the first draw is fixed, it acts like the ticket set.
Extend only after defining the new event If the main draw contains d labels and your selected set contains k, the count becomes C(k,r)C(n−k,d−r)/C(n,d). If an independent special pool is involved, multiply by the appropriate special-pool match probability. If the bonus comes from the remaining main pool, condition on the main draw instead.
Do not treat every “match five” phrase as the same prize. A game's tier can distinguish five main matches with or without a special ball, and its official conditions determine which event you need.
What this tells you about number choice Under the uniform model, the formula depends on how many labels you selected, not on their identities. A six-label set chosen from birthdays and a six-label set chosen by an impartial generator have the same distribution of main match counts against a fresh draw.
Use the overlap calculator to inspect the full distribution and compare it with our independent-pair simulation. The table is an explanation of chance, not a method for deciding which labels will appear next.
Leave the selection to chance
If you want a valid random game line, open the relevant generator. A generated line is not an official entry or a prediction, and it does not improve the probability of a specified valid combination.
Sources and further reading
The worked examples and derivations are RoomForChance explanations. Operator sources establish game parameters; research sources support the specific points identified above. University links are references, not endorsements.
- R Core Team · Hypergeometric distributionTechnical reference for sampling without replacement.
- Joe Blitzstein and Jessica Hwang · Harvard Stat 110 / Introduction to ProbabilityUniversity-level further reading on counting, conditioning and probability models.
Continue the argument
How Often Do Lottery Numbers Repeat Between Draws?
Use the hypergeometric distribution to calculate shared labels between independent draws, including zero overlap and four repeated numbers.
With vs Without Replacement: The Probability Difference
Understand how replacing a drawn item changes independence, duplicate possibilities and the formulas used for lottery and digit games.
How Bonus Balls and Separate Number Pools Change Lottery Odds
Separate special-ball pools and bonus balls drawn from the main pool need different formulas. Learn the distinction with worked examples.