
RoomForChance · Science
Chance is uncertain.
The reasoning needn’t be.
Understand the numbers behind the draw. Follow the proof, inspect the data, and try the model yourself.
Start with the question you came for
Lottery probability
Lottery Probability Explained: Count the Outcomes First
A complete starting point for lottery odds: sample spaces, combinations, separate pools, exact matches and the limits of simulation.
3 min read · Formula & figureNumber choices and common myths
Quick Pick vs Choosing Your Own Numbers: Does Either Have Better Odds?
Compare Quick Pick, Lucky Dip and personal selections while separating draw probability, winner counts and possible prize sharing.
3 min read · Formula & figureNumber choices and common myths
Can AI Predict Lottery Numbers? What a Model Would Need to Learn
Why machine learning cannot extract a predictive signal from independent fair draws, and how to evaluate extraordinary prediction claims.
3 min read · Formula & figurePatterns and surprising results
Is 1-2-3-4-5-6 as Likely as Any Other Lottery Combination?
Yes under a uniform 6/49 model. Understand why a specific ordered-looking line differs from the broad category of all consecutive sets.
3 min read · Formula & figureNumber choices and common myths
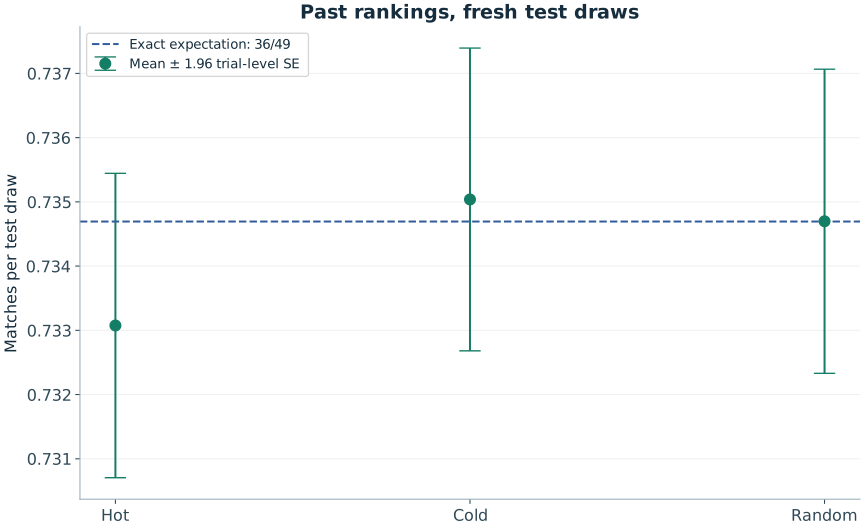
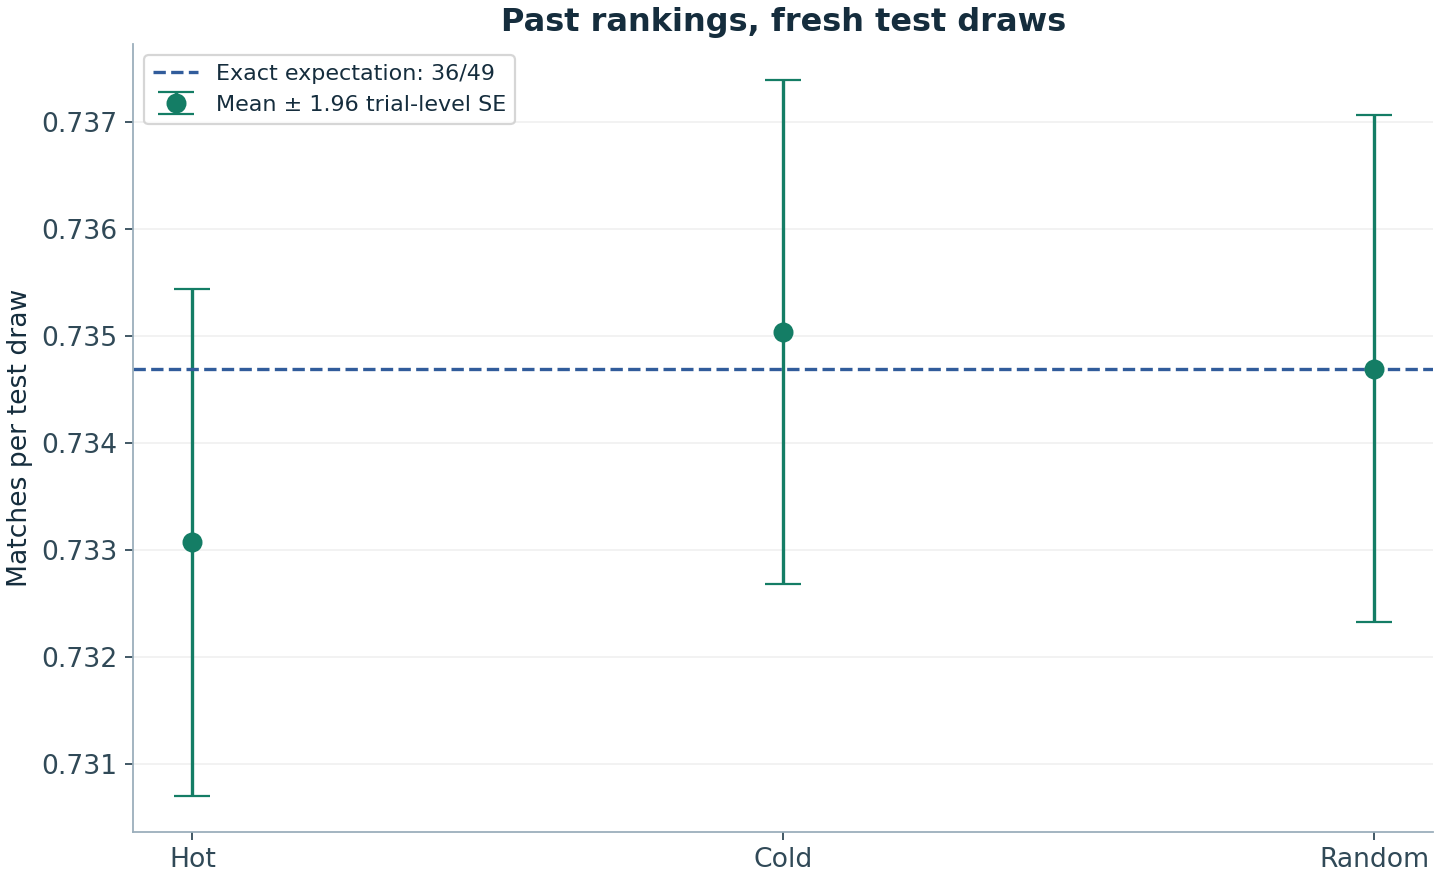
Do Hot and Cold Lottery Numbers Work? A Holdout Test
Examine hot and cold selection rules using conditional probability and an original experiment with separate training and test draws.
3 min read · Formula & figureRandom number generators
How RoomForChance Generates Random Numbers: An Inspectable Method
An implementation-level explanation of RoomForChance’s browser random source, rejection sampling, partial shuffle and separate simulation methodology.
3 min read · Formula & figureRandomness
Start with the process: independence, streaks, repetition and the difference between a random event and a random-looking result.
Randomness
Can Lottery Numbers Repeat? Three Different Questions
Repeated balls, repeated numbers across draws and repeated complete combinations follow different probability rules. See the exact distinctions.
3 min read · Formula & figureRandomness
Independent Events: Why a Fair Draw Has No Memory
Learn conditional probability with coins and lottery draws, including why balls within one draw are dependent while separate draws can be independent.
3 min read · Formula & figureRandomness
Random Does Not Mean Even: Why Frequencies Fluctuate
Why fair random numbers form unequal counts, how variation scales with sample size, and why the law of large numbers does not force compensation.
3 min read · Formula & figureRandomness
What Does a Random Sequence Look Like? The Appearance Trap
Why alternating coins can look more random than genuine samples, and why sorting lottery results changes the patterns you see.
3 min read · Formula & figureRandomness
Why Randomness Creates Streaks, Clusters and Repetitions
Understand random streaks using fixed windows, overlapping opportunities and a clear distinction between a specified run and any run.
3 min read · Formula & figureRandomness
Why Rare Events Happen: Probability Needs an Opportunity Count
Learn the difference between one rare event, at least one occurrence and a surprise found after searching many opportunities.
3 min read · Formula & figureRandomness
What Is Randomness? Probability, Patterns and Uncertainty
Understand randomness through fair draws, unpredictable outcomes and the crucial difference between a random process and a random-looking result.
3 min read · Formula & figureRandom number generators
Inspect sources, seeds and algorithms. Learn how unbiased bounded integers become valid selections.
Random number generators
Cryptographically Secure Random Numbers: What the Claim Means
Learn why CSPRNGs concern unpredictability, why Math.random is different, and why a secure source still needs unbiased range conversion.
3 min read · Formula & figureRandom number generators
How RoomForChance Generates Random Numbers: An Inspectable Method
An implementation-level explanation of RoomForChance’s browser random source, rejection sampling, partial shuffle and separate simulation methodology.
3 min read · Formula & figureRandom number generators
Modulo Bias Explained: Why a Random Byte Makes an Unfair Die
See the exact 256-to-6 mapping behind modulo bias, calculate the imbalance, and understand how rejection sampling removes it.
3 min read · Formula & figureRandom number generators
How to Generate Random Numbers Without Repetition
Learn two fair methods for distinct random numbers, why sorting is safe, and why filtering patterns changes the distribution.
3 min read · Formula & figureRandom number generators
Random Number Generators: From Entropy to a Fair Choice
Understand how random number generators combine a source, an algorithm and a mapping—and why each stage matters for fair lottery selections.
3 min read · Formula & figureRandom number generators
What Is a Random Seed? Reproducing an Experiment Correctly
A random seed is only part of a reproducible simulation. Learn why the algorithm, versions and sequence of calls must also be recorded.
3 min read · Formula & figureRandom number generators
Rejection Sampling: How Discarding Values Can Preserve Fairness
A practical derivation of rejection sampling for integer ranges and distinct lottery numbers, with efficiency and failure cases explained.
3 min read · Formula & figureRandom number generators
True Random vs Pseudorandom: Which Difference Matters?
Compare physical entropy and deterministic random streams without confusing reproducibility, statistical quality and cryptographic security.
3 min read · Formula & figureLottery probability
Count outcomes, distinguish exact events and understand what probability calculations do—and do not—say.
Lottery probability
How Bonus Balls and Separate Number Pools Change Lottery Odds
Separate special-ball pools and bonus balls drawn from the main pool need different formulas. Learn the distinction with worked examples.
3 min read · Formula & figureLottery probability
How Many Lottery Combinations Are There? The C(n,k) Formula
Derive the lottery combination formula, work through C(49,6), and learn when separate pools or ordered digits require a different count.
3 min read · Formula & figureLottery probability
Combinations vs Permutations: Does Order Matter?
Distinguish unordered lottery sets from ordered digit games, with replacement rules and examples that prevent common counting errors.
3 min read · Formula & figureLottery probability
Why Duplicate Lottery Lines Do Not Increase Coverage
Distinguish repeated labels, repeated full lines and repeated entries across draws, and calculate how duplicates reduce distinct outcome coverage.
3 min read · Formula & figureLottery probability
How to Calculate the Probability of Matching Lottery Numbers
Derive the hypergeometric formula for exactly r matches and distinguish exact, at-least and separate-pool matching events.
3 min read · Formula & figureLottery probability
Lottery Probability Explained: Count the Outcomes First
A complete starting point for lottery odds: sample spaces, combinations, separate pools, exact matches and the limits of simulation.
3 min read · Formula & figureLottery probability
Do More Lottery Tickets Increase Your Odds? The Exact Mathematics
Compare distinct lines in one draw, duplicate lines and repeated independent draws without confusing relative improvement with a likely win.
3 min read · Formula & figureLottery probability
Probability vs Odds: What Does “1 in a Million” Mean?
Convert probabilities, percentages and odds against correctly, and learn why one-in-X is not a deadline for a rare event.
3 min read · Formula & figureLottery probability
With vs Without Replacement: The Probability Difference
Understand how replacing a drawn item changes independence, duplicate possibilities and the formulas used for lottery and digit games.
3 min read · Formula & figureNumber choices and common myths
Examine hot numbers, overdue claims, AI predictions and human preferences using explicit models and research.
Number choices and common myths
Can AI Predict Lottery Numbers? What a Model Would Need to Learn
Why machine learning cannot extract a predictive signal from independent fair draws, and how to evaluate extraordinary prediction claims.
3 min read · Formula & figureNumber choices and common myths
Are Birthday Numbers a Bad Idea? Winning and Sharing Are Different
Why birthday selections have equal draw odds but may concentrate player choices, and why that does not establish a guaranteed financial advantage.
3 min read · Formula & figureNumber choices and common myths
The Gambler’s Fallacy: Why a Number Does Not Become Due
A mathematical explanation of the gambler’s fallacy, separating an unlikely past streak from the unchanged probability of the next independent event.
3 min read · Formula & figureNumber choices and common myths
Do Hot and Cold Lottery Numbers Work? A Holdout Test
Examine hot and cold selection rules using conditional probability and an original experiment with separate training and test draws.
3 min read · Formula & figureNumber choices and common myths
The Hot Hand and Lottery Numbers: Do Not Confuse Different Mechanisms
Why evidence about human sporting streaks cannot be transferred to independent lottery draws, and how selection bias complicates streak analysis.
3 min read · Formula & figureNumber choices and common myths
Why Humans Do Not Choose Numbers Randomly
Explore the difference between human selection and uniform sampling, with research on number preferences and a measurable coin-sequence example.
3 min read · Formula & figureNumber choices and common myths
Are Overdue Lottery Numbers More Likely to Be Drawn?
Calculate the probability of long absences, understand geometric waiting times, and distinguish a fixed number from the most overdue number.
3 min read · Formula & figureNumber choices and common myths
Quick Pick vs Choosing Your Own Numbers: Does Either Have Better Odds?
Compare Quick Pick, Lucky Dip and personal selections while separating draw probability, winner counts and possible prize sharing.
3 min read · Formula & figurePatterns and surprising results
Consecutive labels, balanced categories and repeated combinations make more sense when the outcome space is visible.
Patterns and surprising results
The Birthday Paradox in Lottery Draws: Any Repeat vs One Repeat
Why any repeated combination becomes plausible much sooner than a chosen combination returning, with exact and approximate collision formulas.
3 min read · Formula & figurePatterns and surprising results
How Likely Are Consecutive Lottery Numbers? An Exact Formula
Derive the probability of at least one consecutive pair in a k-of-n draw and see why it is nearly half for a 6/49 lottery.
3 min read · Formula & figurePatterns and surprising results
How Often Do Lottery Numbers Repeat Between Draws?
Use the hypergeometric distribution to calculate shared labels between independent draws, including zero overlap and four repeated numbers.
3 min read · Formula & figurePatterns and surprising results
Lottery Number Sums: Why Middle Totals Are Common
Derive the expected sum and variance of a uniform lottery draw, and explain why selecting a common sum does not improve a ticket’s odds.
3 min read · Formula & figurePatterns and surprising results
Are Balanced Lottery Numbers Better? Odd and Even Categories Explained
Compute odd/even category probabilities while showing why a three-odd three-even line has no individual advantage over an all-odd line.
3 min read · Formula & figurePatterns and surprising results
Is 1-2-3-4-5-6 as Likely as Any Other Lottery Combination?
Yes under a uniform 6/49 model. Understand why a specific ordered-looking line differs from the broad category of all consecutive sets.
3 min read · Formula & figurePatterns and surprising results
Three Consecutive Lottery Numbers: Why Pair Counting Is Not Enough
Calculate a specified triple, distinguish expected triple counts from occurrence probability, and avoid double-counting overlapping runs.
3 min read · Formula & figureStatistics and simulation
Read data with the right denominator, measure uncertainty and separate exploration from prediction.
Statistics and simulation
Why Lottery Backtesting Can Fool You
Spot overfitting, test-set reuse and future leakage, and learn what a fair prospective evaluation of a lottery selection rule would require.
3 min read · Formula & figureStatistics and simulation
Expected vs Observed Lottery Frequencies: Reading a Table Properly
Learn expected counts, standard deviations and selection effects so a lottery frequency table describes data without pretending to predict the future.
3 min read · Formula & figureStatistics and simulation
The Law of Large Numbers Does Not Make a Losing Number Due
See how sample proportions stabilize without future compensation, and why absolute deviations can grow while relative errors shrink.
3 min read · Formula & figureStatistics and simulation
Monte Carlo Simulation: Learn Probability by Repeating the Model
Build a trustworthy probability simulation with a defined event, reproducible generator, uncertainty estimate and exact benchmark where available.
3 min read · Formula & figureStatistics and simulation
Multiple Comparisons: Why Random Data Keeps Producing “Signals”
Calculate how repeated testing creates false alarms and learn why a pattern found after a broad search needs a different interpretation.
3 min read · Formula & figureStatistics and simulation
Monte Carlo Error: Why a Million Trials Can Still Be Too Few
Estimate simulation precision, understand zero observed successes and distinguish absolute error from relative error for rare events.
3 min read · Formula & figureStatistics and simulation
Can Statistical Tests Prove Lottery Numbers Are Random?
Learn what frequency, runs and goodness-of-fit tests can detect, and why passing tests is not proof of fairness or unpredictability.
3 min read · Formula & figureUS, UK and international game mathematics
Follow each matrix from official pool definitions to an inspectable calculation, then open the associated generator.
US, UK and international game mathematics
Canada LOTTO 6/49: Classic Draw Odds and the Separate Gold Ball Question
Why the Classic Draw has 13,983,816 main combinations and why that denominator does not describe Canada’s separate Gold Ball Draw.
3 min read · Formula & figureUS, UK and international game mathematics
EuroMillions Odds: Five Numbers, Two Lucky Stars and 139,838,160 Outcomes
Derive EuroMillions match probabilities, including five main numbers with no Lucky Stars, and keep raffle codes separate from the number matrix.
3 min read · Formula & figureUS, UK and international game mathematics
Lotto America Odds: How 5/52 + 1/10 Produces 25,989,600 Outcomes
Derive Lotto America’s jackpot matrix, separate the Star Ball from a multiplier and compare exact match events correctly.
3 min read · Formula & figureUS, UK and international game mathematics
Mega Millions Odds: The 70 × 24 Matrix Explained
Calculate current Mega Millions jackpot odds as C(70,5) × 24, understand the old-denominator trap and separate multipliers from number selection.
3 min read · Formula & figureUS, UK and international game mathematics
Powerball Odds Explained: Why the Jackpot Is 1 in 292,201,338
Derive US Powerball’s full-match probability from five white balls and a separate red ball, and distinguish jackpot odds from partial matches.
3 min read · Formula & figureUS, UK and international game mathematics
Set For Life Odds: The 5/47 + 1/10 Calculation
Derive Set For Life’s full-match probability, understand the separate Life Ball and distinguish matching odds from payment structure.
3 min read · Formula & figureUS, UK and international game mathematics
Thunderball Odds Explained: 8,060,598 Complete Combinations
Calculate Thunderball’s 5/39 + 1/14 outcome space and learn why the special-ball pool affects partial-match categories.
3 min read · Formula & figureUS, UK and international game mathematics
UK Lotto Mathematics: Why a Single 6/59 Round Has 45,057,474 Outcomes
Understand the UK Lotto 6/59 main-number calculation, the Bonus Ball distinction and why a per-round probability is not a whole-event probability.
3 min read · Formula & figureEvidence you can inspect
The Lab publishes seeds, executable code, aggregate or trial-level CSV files, uncertainty notes and limitations. The studies are educational simulations, not historical lottery data or externally peer-reviewed research.