
Statistical tests can detect particular departures from a specified random model. They cannot prove that every aspect of a process is perfectly random, certify an implementation from one short sample, or establish cryptographic unpredictability simply because a histogram looks balanced.
A test is a targeted question with assumptions. Its result is most useful when those assumptions and the target are visible.
Different tests look for different problems A frequency test asks whether counts are compatible with specified probabilities. A runs test examines a kind of sequential structure. A goodness-of-fit test compares an observed distribution with a model. A process can look ordinary on one dimension and unusual on another.
NIST's statistical handbook describes runs and chi-square procedures, including assumptions and limitations. Those procedures are methodological references, not ready-made certificates for every lottery dataset.
A fair-looking frequency table can hide dependence Consider a sequence cycling through 1,2,3,4. Its frequencies become exactly balanced over complete cycles, but its next value is predictable. A frequency-only check would miss the problem. Conversely, a genuinely independent sample can have unequal counts without signalling a defect.
Testing must match the property you care about: distribution, dependence, implementation correctness or security. No one statistic substitutes for all of them.
Lottery counts need the right sampling model In k-of-n draws, each individual label count across independent draws is binomial. The vector of all label counts is not a set of independent binomial variables because every draw contributes exactly k inclusions. A naive chi-square calibration based on independent single-category observations may therefore be inappropriate for those overlapping inclusions.
One solution is to derive the correct null distribution for the statistic. Another is to simulate the entire draw mechanism and compare the statistic with its simulated null distribution. The latter still needs correct code, sufficient replications and an explicitly defined test.
Failure to reject is not proof A test can fail to detect a real but small departure because the sample is too small or because the departure lies outside what the statistic measures. This is a question of power. Saying “no statistically significant evidence was found by this test” is more accurate than saying “randomness was proved”.
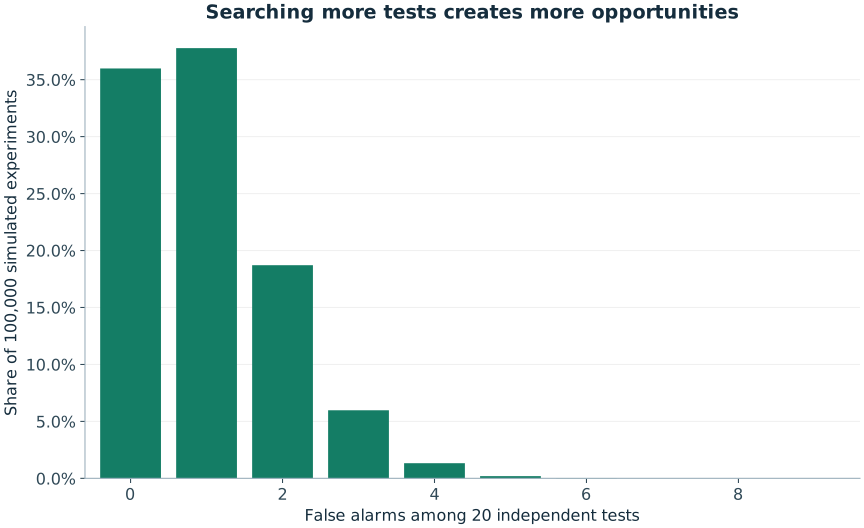
A rejection is not automatically proof of misconduct either. Check data quality, rule changes, model fit and the number of tests searched. A small p-value concerns compatibility with a model; it does not identify the explanation.
A practical evidence ladder Start with verified data and a correct game definition. Prespecify the question where possible. Inspect the complete result, quantify uncertainty, and account for multiple comparisons. If the finding is exploratory, confirm it on fresh observations. For implementation claims, inspect the algorithm as well as the output.
Our Lab publishes its model and source code so readers can check the intended mechanism directly. Its simulated results are educational evidence about that model, not a certification of any operator. That limited claim is more useful than a grand assurance that the available tests cannot support.
Leave the selection to chance
If you want a valid random game line, open the relevant generator. A generated line is not an official entry or a prediction, and it does not improve the probability of a specified valid combination.
Sources and further reading
The worked examples and derivations are RoomForChance explanations. Operator sources establish game parameters; research sources support the specific points identified above. University links are references, not endorsements.
- NIST/SEMATECH · Runs testA reference on a specific sequential test, not a universal certification of randomness.
- NIST/SEMATECH · Chi-square goodness-of-fit testAssumptions and calibration matter; lottery inclusion counts are not independent multinomial observations.
- Joe Blitzstein and Jessica Hwang · Harvard Stat 110 / Introduction to ProbabilityUniversity-level further reading on counting, conditioning and probability models.
Continue the argument
Multiple Comparisons: Why Random Data Keeps Producing “Signals”
Calculate how repeated testing creates false alarms and learn why a pattern found after a broad search needs a different interpretation.
Cryptographically Secure Random Numbers: What the Claim Means
Learn why CSPRNGs concern unpredictability, why Math.random is different, and why a secure source still needs unbiased range conversion.
Expected vs Observed Lottery Frequencies: Reading a Table Properly
Learn expected counts, standard deviations and selection effects so a lottery frequency table describes data without pretending to predict the future.