
A 5% statistical test does not mean that every reported finding has a 95% chance of being true. Under its null model and calibration assumptions, it means the test falsely rejects on 5% of repetitions. If you run many tests and report whichever looks significant, the chance of at least one false alarm can be much larger.
Lottery datasets offer countless tests: individual labels, pairs, sums, gaps, windows, weekdays and selected combinations of these features. The search itself becomes part of the analysis.
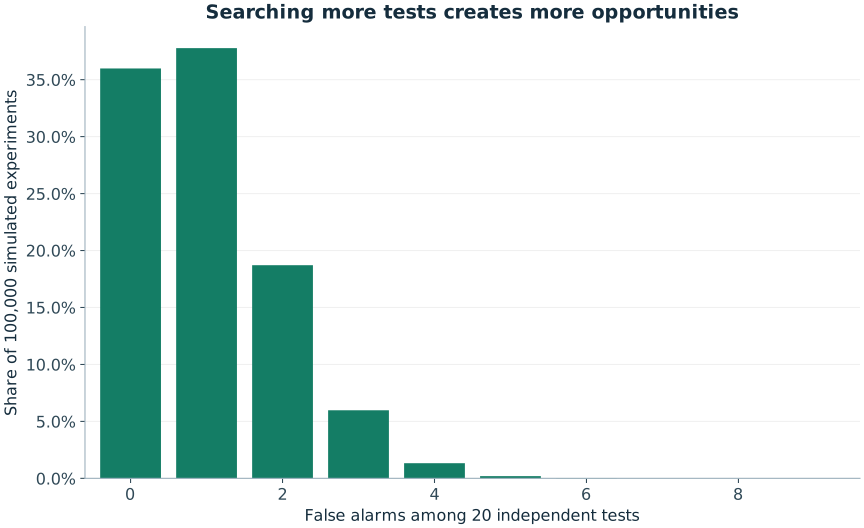
Twenty independent chances If 20 tests are independent and each has an exact 5% false-positive rate under the null, the chance of no false alarms is 0.95^20. The chance of at least one is 1−0.95^20 ≈ 64.15%.
Our experiment simulates that mechanism directly as 20 independent Bernoulli alarm indicators, repeated 100,000 times. At least one alarm occurred in 64.015% of experiments. These are simulated indicators, not p-values calculated from historical lottery draws. The simplified design isolates the opportunity effect.
Real tests may be dependent Tests sharing the same draw record can be strongly related. A high count for one label constrains other counts because each draw contains a fixed number of labels. The independent-test formula is then not exact.
A general upper bound for at least one false rejection is the sum of the individual false-positive probabilities. This union bound does not require independence. Dividing an overall significance budget across a prespecified family of tests is the basic idea behind a Bonferroni adjustment, though other approaches can be more appropriate for particular goals.
Choosing the question afterwards adds flexibility Suppose no individual label is impressive, but one pair is. If no pair is impressive, perhaps a 30-draw window is. If that fails, perhaps a weekday subset is. Reporting only the final successful search conceals the opportunities that produced it.
The same issue arises when a model's settings are tuned repeatedly against a nominal test set. The test data have influenced the chosen model and no longer provide a fully independent assessment.
A defensible workflow Write down the hypothesis, statistic, data period and decision rule before inspecting the evaluation data. State the family of comparisons. Preserve negative results as well as positive ones. Use a genuinely new dataset for confirmation when the initial work was exploratory.
Exploration is valuable; it generates questions. It becomes misleading when an exploratory surprise is presented as if it had been a successful advance prediction.
What a small p-value does not establish It does not identify the cause of a departure, prove a lottery is rigged, measure the size of an effect or guarantee a profitable forecast. Data errors, changing rules and model assumptions may need investigation.
The practical question for a prediction claim is therefore broader than “Was one test significant?” Ask how many routes were tried, what was held back, and whether the apparent effect survived a clean follow-up. Random data has enough variety to reward a patient searcher with stories; rigorous design determines which stories deserve belief.
Leave the selection to chance
If you want a valid random game line, open the relevant generator. A generated line is not an official entry or a prediction, and it does not improve the probability of a specified valid combination.
Sources and further reading
The worked examples and derivations are RoomForChance explanations. Operator sources establish game parameters; research sources support the specific points identified above. University links are references, not endorsements.
- Joe Blitzstein and Jessica Hwang · Harvard Stat 110 / Introduction to ProbabilityUniversity-level further reading on counting, conditioning and probability models.
Continue the argument
Why Lottery Backtesting Can Fool You
Spot overfitting, test-set reuse and future leakage, and learn what a fair prospective evaluation of a lottery selection rule would require.
Can Statistical Tests Prove Lottery Numbers Are Random?
Learn what frequency, runs and goodness-of-fit tests can detect, and why passing tests is not proof of fairness or unpredictability.
Why Rare Events Happen: Probability Needs an Opportunity Count
Learn the difference between one rare event, at least one occurrence and a surprise found after searching many opportunities.