
What happened
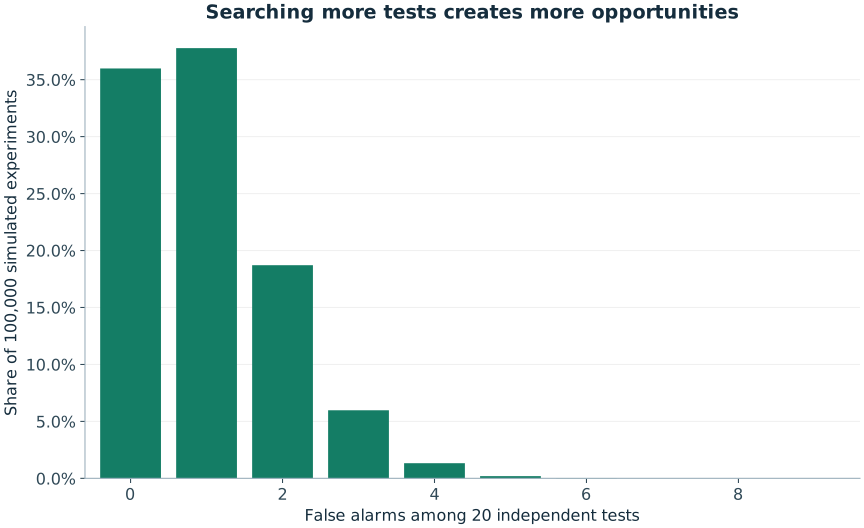
At least one alarm occurred in 64.015% of 100,000 experiments. The exact independent-test probability is 1−0.95^20 ≈ 64.15140776%.
A nominal 5% threshold applies to one calibrated test, not to the chance that a search through many tests will produce an exciting result. Selecting only the successful test conceals the search that produced it.
Method and benchmark
Model 20 independent tests with exactly calibrated 5% false-positive rates as Bernoulli indicators, repeated 100,000 times. This isolates the multiple-comparisons mechanism.
This deliberately simplified experiment generates twenty Bernoulli indicators with success probability 0.05. It does not compute p-values from lottery history and should not be described as doing so. The indicators represent perfectly calibrated independent false alarms.
Python 3.12.14 · NumPy 2.3.5 · NumPy PCG64 · seed 20260931. Each experiment starts a separate stream. Code and all datasets are linked below.
What this does not establish
Actual lottery tests often share data and are dependent; 1−0.95^20 is then not exact. These are simulated significance indicators, not computed p-values from historical draw data.
Actual tests on the same lottery data can be dependent. Their family-wise probability needs the appropriate dependence model or a valid bound. The experiment isolates one mechanism clearly rather than claiming to reproduce every detail of real statistical testing.
These are original educational simulations prepared for RoomForChance. They are not historical lottery records, a physical-machine audit, an external peer review or evidence of a prediction advantage.
Inspect the data
Download multiple-testing.csv · All results and metadata (JSON) · Download the complete Python program · Download figure-generation code
| false positive count | experiments |
|---|---|
| 0 | 35,985 |
| 1 | 37,770 |
| 2 | 18,712 |
| 3 | 5,979 |
| 4 | 1,332 |
| 5 | 197 |
| 6 | 20 |
| 7 | 3 |
| 8 | 2 |
| 9 | 0 |
| 10 | 0 |
| 11 | 0 |
| 12 | 0 |
| 13 | 0 |
| 14 | 0 |
| 15 | 0 |
| 16 | 0 |
| 17 | 0 |
| 18 | 0 |
| 19 | 0 |
| 20 | 0 |
Reproduce the experiment
Download the Python program to an empty working folder. Use the recorded environment for an exact replay. The program runs all eleven studies and creates a lab-data folder containing the result files. The largest study performs ten million draws; allow time for it to finish.
python -m pip install numpy==2.3.5
python run_experiments.py
Expected CSV SHA-256: dcde88eeabb849c4f3b29366a0f4ad5d12e267d941cea5ba11c57f90b8d3c59c. A matching seed alone is insufficient if you change the implementation or call sequence. The CSV files use CC BY 4.0; the original code uses the MIT license included with the downloads.
Read the reasoning
Multiple Comparisons: Why Random Data Keeps Producing “Signals”
Calculate how repeated testing creates false alarms and learn why a pattern found after a broad search needs a different interpretation.
Can Statistical Tests Prove Lottery Numbers Are Random?
Learn what frequency, runs and goodness-of-fit tests can detect, and why passing tests is not proof of fairness or unpredictability.
Technical references
NumPy PCG64 documentation describes the generator family. Harvard Stat 110 provides university-level probability background. The model-specific derivation is linked above.