
The sum of a lottery line is not uniformly distributed even when every individual combination is equally likely. Many different sets produce middle totals, while very few produce extreme totals. A common sum is therefore a common category, not a source of extra probability for a particular line inside it.
For a k-of-n draw using labels 1 through n, the expected sum is k(n+1)/2. In a 6/49 model, that expectation is 150.
Why the mean is simple Each label j appears with probability k/n. Write the sum as the sum of j times its inclusion indicator. By linearity of expectation, the expected total is (k/n)(1+2+…+n) = k(n+1)/2.
No assumption that the inclusion indicators are independent is needed for this mean. They are dependent because exactly k labels are selected. That dependence matters when calculating the variance.
Account for sampling without replacement The population variance of labels 1–n is (n²−1)/12. The variance of the sum of k labels sampled without replacement is k(n−k)(n+1)/12. For 6/49, this is 1,075, giving a standard deviation of about 32.79.
Using k independent draws with replacement would omit the finite-population correction and produce a different variance. The mean can match while the spread is wrong, which is why checking only the average does not validate a simulator.
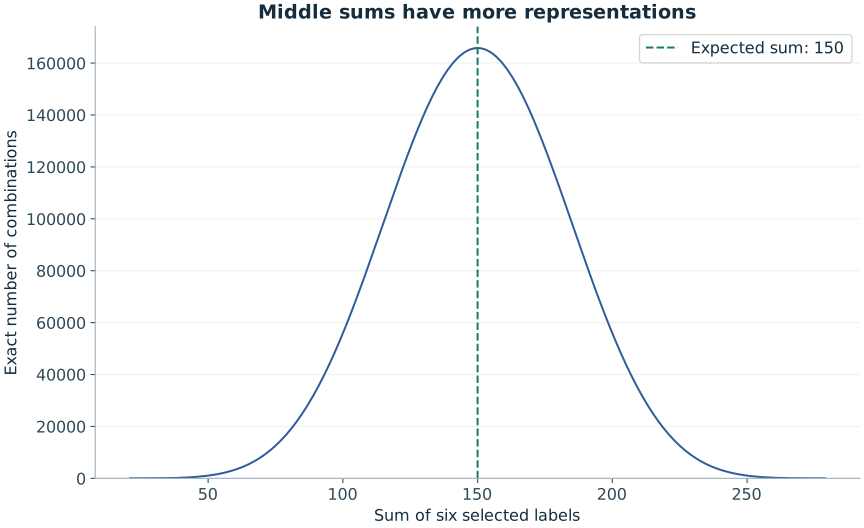
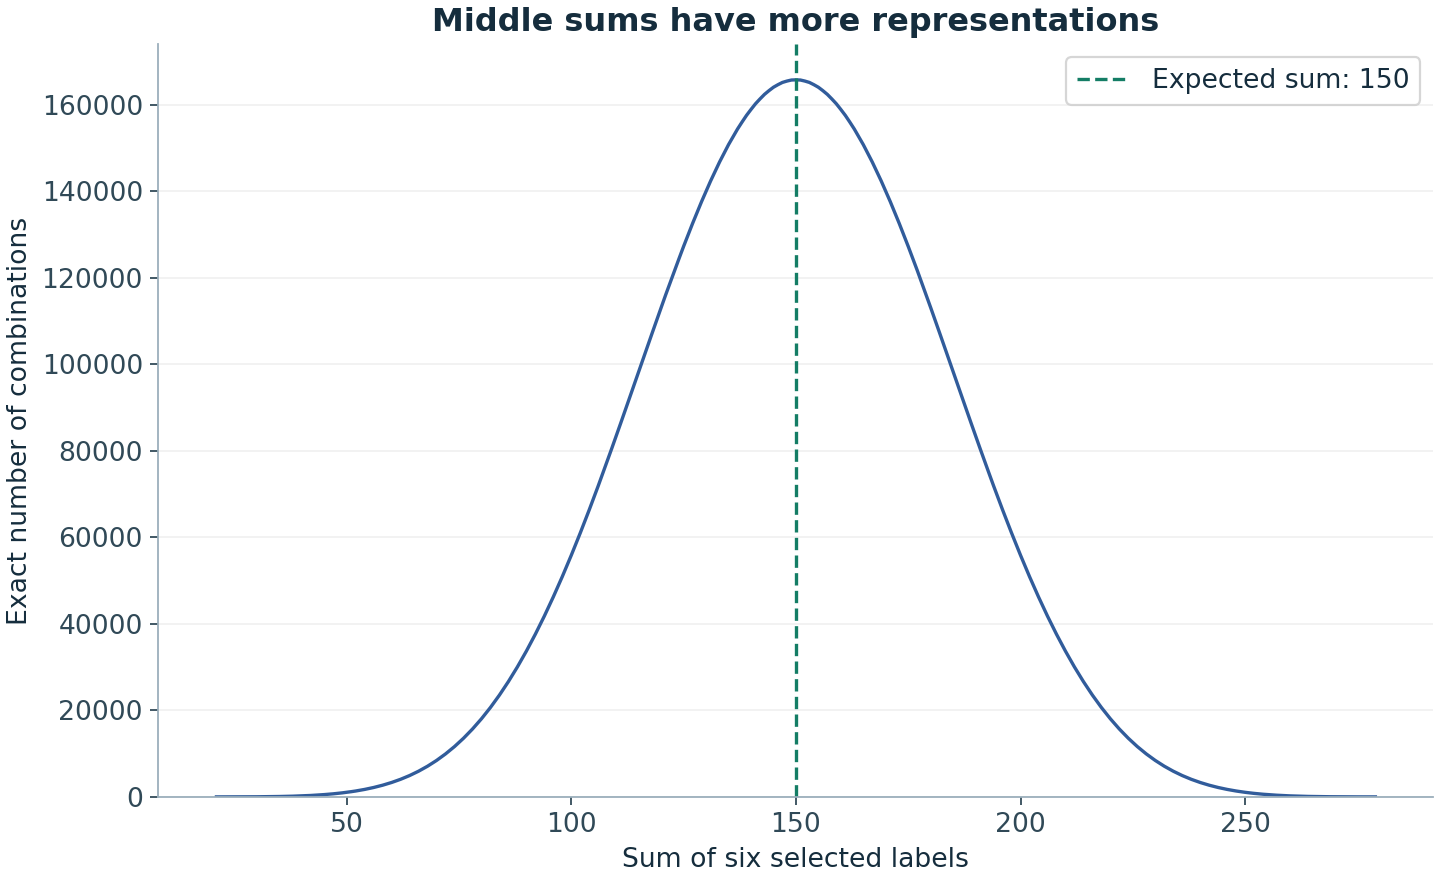
Extreme sums have few representations The minimum six-label sum in 1–49 is 1+2+3+4+5+6 = 21. Exactly one set achieves it. The maximum is 44+45+46+47+48+49 = 279, also achieved by one set. Many sets achieve totals near 150.
The mapping j → n+1−j pairs each set with another whose sum is k(n+1) minus the original sum. This establishes symmetry of the sum distribution around k(n+1)/2. It does not make every sum equally likely.
How to count a sum exactly A dynamic program can process labels one at a time while tracking the number selected and their current sum. For each label, either omit it or include it. The final state for k selections and total s counts the sets with that sum.
Equivalently, the coefficient of y^k x^s in the product of (1 + yx^j) over j = 1…n gives the count. This generating-function description is compact, but the dynamic program is often easier to implement and explain.
Why a sum filter does not improve a specified line A line with sum 150 wins the full match only when its exact labels are drawn, not whenever the draw's sum is 150. A filter that keeps middle totals changes the distribution of your selected lines. It does not change the external uniform probability assigned to each valid line.
Use sums as a way to study the geometry of the outcome space. If a proposed system claims an advantage from “optimal totals”, ask whether it is comparing whole categories with single entries. That category-to-ticket jump is where the mathematical justification usually disappears.
Leave the selection to chance
If you want a valid random game line, open the relevant generator. A generated line is not an official entry or a prediction, and it does not improve the probability of a specified valid combination.
Sources and further reading
The worked examples and derivations are RoomForChance explanations. Operator sources establish game parameters; research sources support the specific points identified above. University links are references, not endorsements.
- Joe Blitzstein and Jessica Hwang · Harvard Stat 110 / Introduction to ProbabilityUniversity-level further reading on counting, conditioning and probability models.
Continue the argument
Are Balanced Lottery Numbers Better? Odd and Even Categories Explained
Compute odd/even category probabilities while showing why a three-odd three-even line has no individual advantage over an all-odd line.
Is 1-2-3-4-5-6 as Likely as Any Other Lottery Combination?
Yes under a uniform 6/49 model. Understand why a specific ordered-looking line differs from the broad category of all consecutive sets.
With vs Without Replacement: The Probability Difference
Understand how replacing a drawn item changes independence, duplicate possibilities and the formulas used for lottery and digit games.