
A three-odd, three-even category is more likely than the all-odd category in a uniform 6/49 draw. But one specified balanced line is not more likely than one specified all-odd line. The apparent contradiction disappears when we count how many individual combinations each category contains.
The pool 1–49 contains 25 odd labels and 24 even labels. That asymmetry also means all-odd and all-even categories are not exactly equally likely.
Count a category Exactly r odd labels in a six-number draw can be selected in C(25,r) ways. The remaining 6−r even labels can be selected in C(24,6−r) ways. The category probability is their product divided by C(49,6).
For r = 3, the numerator is C(25,3)C(24,3). For an all-odd draw, it is C(25,6). A larger numerator means more sets in the category, not an extra probability attached to each set.
A ticket does not cover its category Suppose your line is {1,2,3,4,5,6}. It has three odd and three even labels, but it wins the full match only when that exact set appears. It does not win whenever any balanced set appears.
The same is true of {1,3,5,7,9,11}: it is one all-odd set, not the whole all-odd category. Both exact lines have probability 1/13,983,816. Comparing a category on one side and a single member on the other creates a misleading advantage.
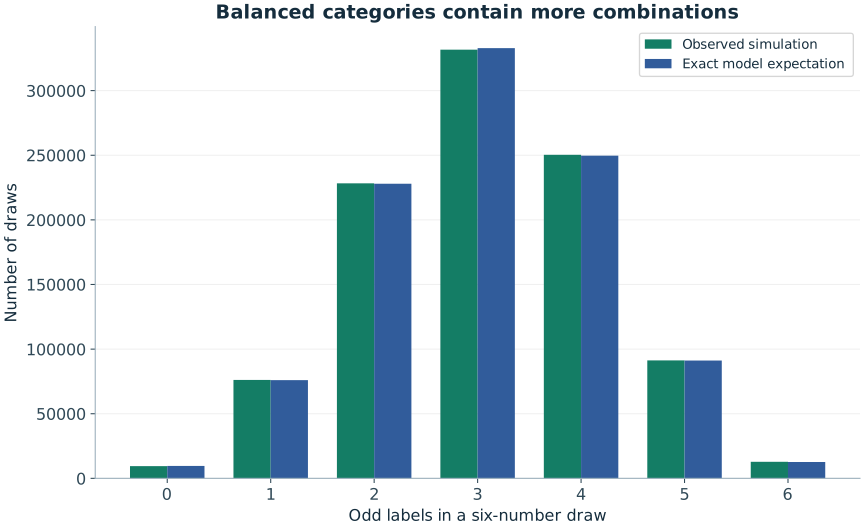
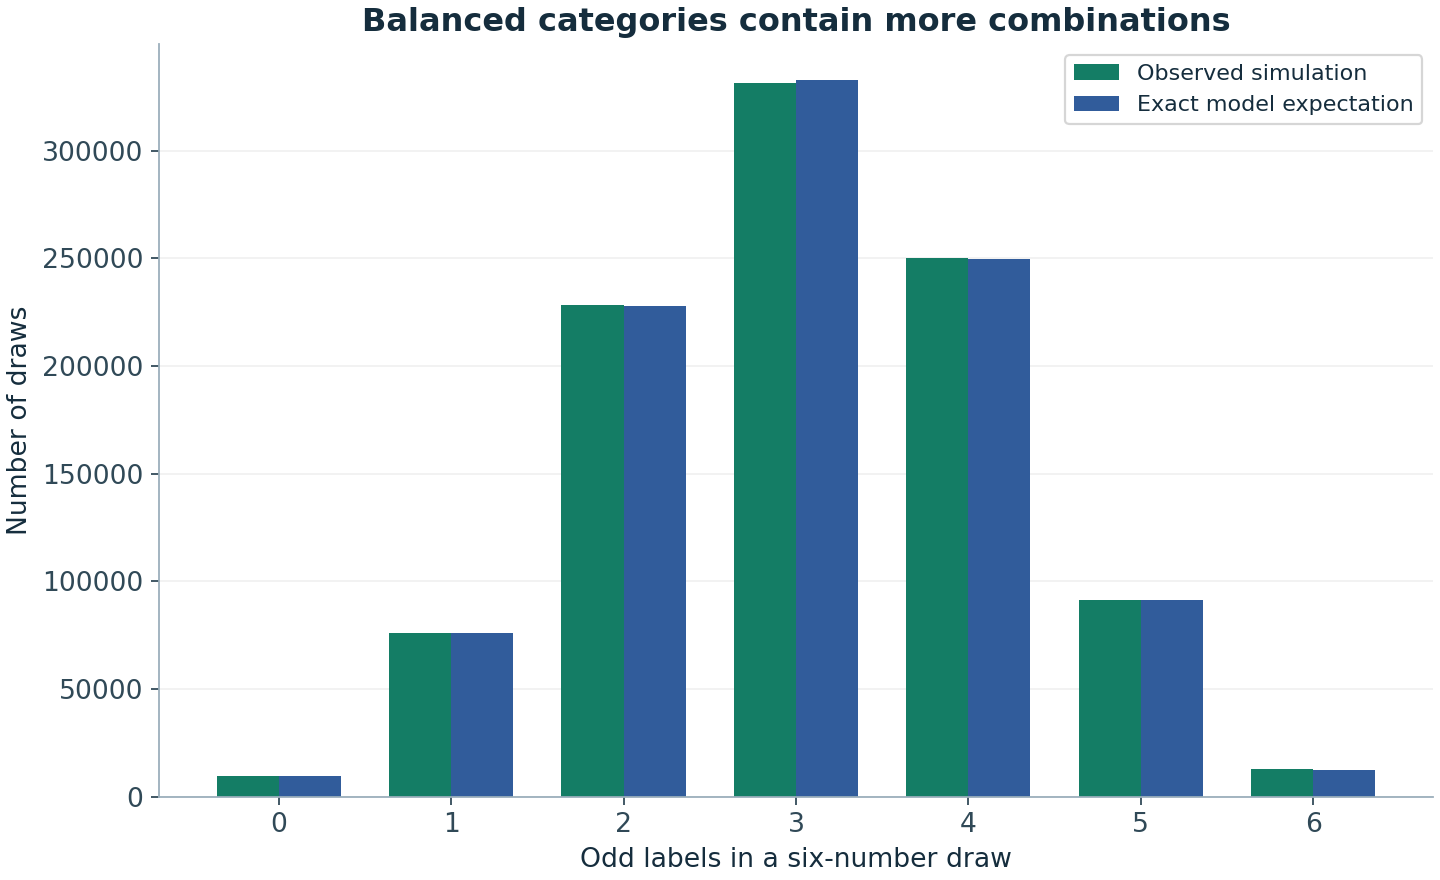
What the simulation shows In one million synthetic 6/49 draws, our Lab observed three odd labels in 33.1666% of draws and all six odd in 1.2827%. The accompanying figure compares all seven observed categories with the exact combinatorial expectations.
The display includes zero through six odd labels, so readers see the complete partition rather than selected bars. The probabilities sum to one because every valid set belongs to exactly one odd-count category.
Why forcing balance changes a generator An unrestricted uniform generator can produce any valid set. A generator that rejects all but three-odd, three-even sets samples from a smaller conditional space. That may satisfy a preference, but it is no longer uniform over the original full space.
If the external draw remains uniform over all valid sets, the final specified line still has the same match probability as before. The filter changes which line you tend to choose, not the chance assigned to that line by the draw.
The same reasoning applies elsewhere Low/high categories, sum bands, repeated final digits and spacing patterns all group many individual outcomes. A common group can contain many individually rare members. The category sketch based on six coin tosses provides a smaller visual version: 20 strings have three heads, yet each individual string still has probability 1/64.
Use the parity calculator to inspect the actual counts for different pools. It separates odd and even population sizes and displays exact category numerators. The purpose is to make the distinction visible enough that a future “balanced-number system” can be assessed without relying on its marketing.
Leave the selection to chance
If you want a valid random game line, open the relevant generator. A generated line is not an official entry or a prediction, and it does not improve the probability of a specified valid combination.
Sources and further reading
The worked examples and derivations are RoomForChance explanations. Operator sources establish game parameters; research sources support the specific points identified above. University links are references, not endorsements.
- Joe Blitzstein and Jessica Hwang · Harvard Stat 110 / Introduction to ProbabilityUniversity-level further reading on counting, conditioning and probability models.
Continue the argument
Is 1-2-3-4-5-6 as Likely as Any Other Lottery Combination?
Yes under a uniform 6/49 model. Understand why a specific ordered-looking line differs from the broad category of all consecutive sets.
How Likely Are Consecutive Lottery Numbers? An Exact Formula
Derive the probability of at least one consecutive pair in a k-of-n draw and see why it is nearly half for a 6/49 lottery.
Lottery Number Sums: Why Middle Totals Are Common
Derive the expected sum and variance of a uniform lottery draw, and explain why selecting a common sum does not improve a ticket’s odds.