
Hot numbers have appeared frequently in a chosen historical window; cold numbers have appeared less often. Those labels describe a sample. Under a uniform independent draw model, neither label changes a number's probability of appearing next. The strongest explanation combines a short conditional-probability argument with an experiment that keeps past and future separate.
A leaderboard always has a top and a bottom Even if every label has exactly the same probability, finite counts differ. Ranking 49 labels guarantees that some appear near the top. Calling those labels hot adds a memorable description but no new evidence of a persistent advantage.
The window also matters. A number can be hot over the last 20 draws and ordinary over the last 200. Choosing the window after seeing which one makes a strategy look strongest adds another layer of selection.
The exact benchmark Let a rule use the entire past to choose six distinct labels. Once that choice has been made, the next uniform independent 6/49 draw includes each chosen label with probability 6/49. The expected number of matches is therefore 6 × 6/49 = 36/49.
This argument applies whether the six labels were selected because they were hot, cold, overdue, attractive or generated by a complex algorithm. It assumes the future draw is uniform and independent of the information used by the rule. A real persistent bias would be a different hypothesis requiring evidence.
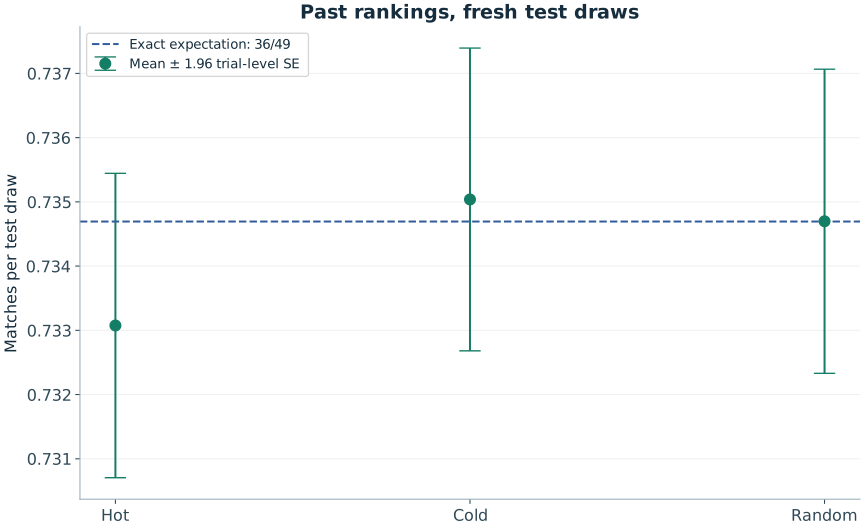
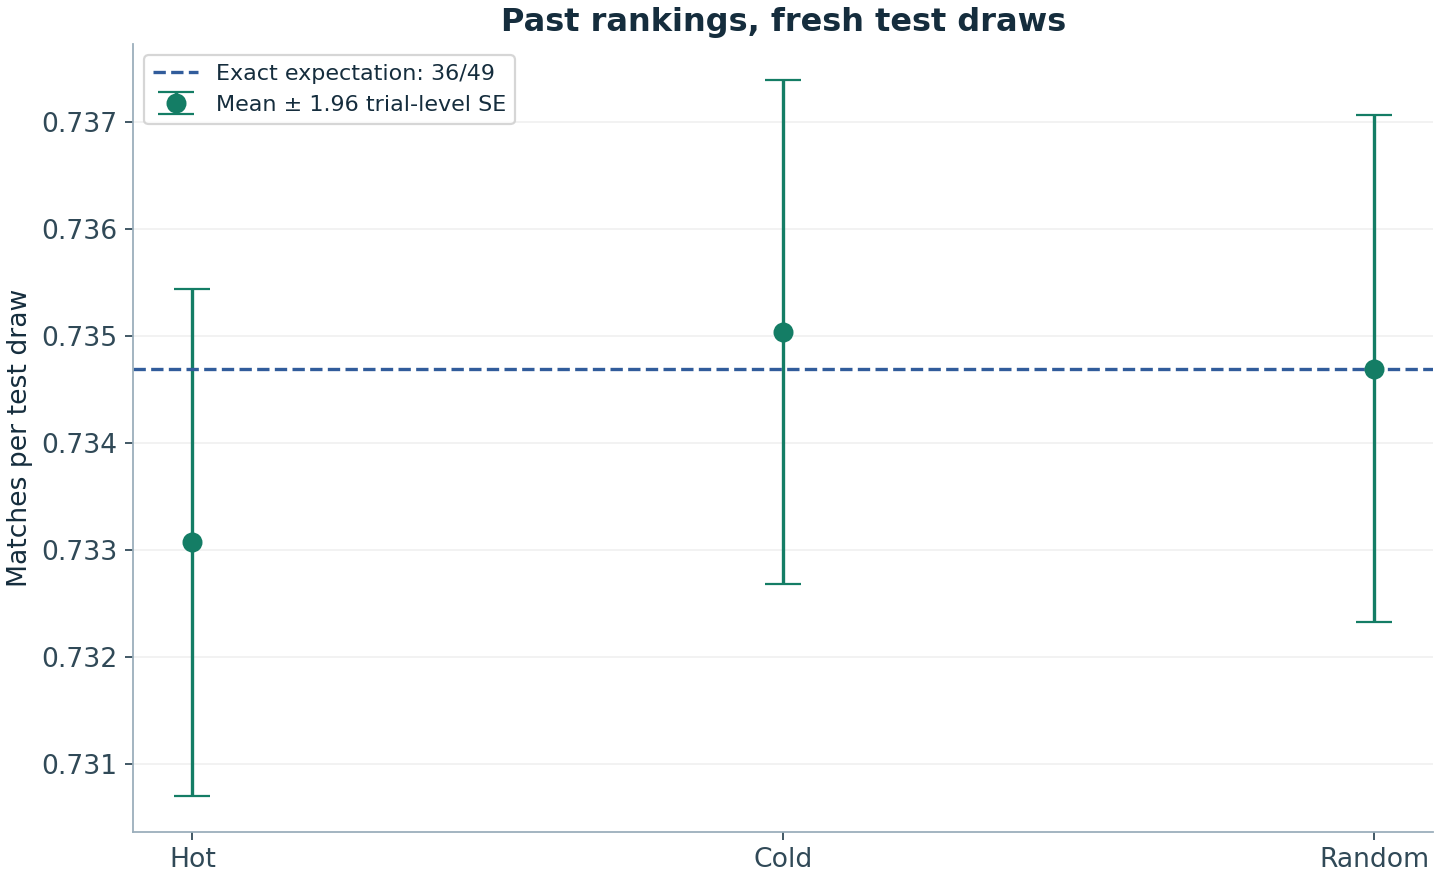
What our experiment actually did In each of 20,000 independent trials, the Lab generated 100 training draws, ranked the labels, broke ties randomly and froze a hot set and a cold set of six labels. It also selected a random six-label baseline. Each set was evaluated against 20 fresh test draws.
The average matches per test draw were 0.733075 for hot sets, 0.735038 for cold sets and 0.734697 for random sets. The theoretical value is approximately 0.734694. Trial-level standard errors were about 0.0012. These results are consistent with the benchmark; the tiny ordering of the observed means is not a useful predictive ranking.
Why the design matters Scoring a hot-number rule on the same draws that made the numbers hot would reward the selection process for rediscovering its training data. Our test draws are separate. Treating every ball as an independent observation would also misrepresent the sampling structure, so uncertainty is calculated at the independent trial level.
The experiment uses synthetic fair draws. It illustrates a model, not a historical audit of any operator. The theorem supplies the general result under independence; the experiment makes its consequences tangible.
Read frequency pages for what they are A frequency table can be useful descriptive information or a starting point for a properly controlled investigation. It is not a forecast merely because its columns are coloured and sorted. Ask whether a claimed advantage survives fresh data, how many rules were tried, and whether the full test procedure is available.
You can reproduce our comparison from the published code and trial-level CSV. You can also generate a random game line without adopting a story about momentum. The choice mechanism changes; the fair draw's probabilities do not.
Leave the selection to chance
If you want a valid random game line, open the relevant generator. A generated line is not an official entry or a prediction, and it does not improve the probability of a specified valid combination.
Sources and further reading
The worked examples and derivations are RoomForChance explanations. Operator sources establish game parameters; research sources support the specific points identified above. University links are references, not endorsements.
- Joe Blitzstein and Jessica Hwang · Harvard Stat 110 / Introduction to ProbabilityUniversity-level further reading on counting, conditioning and probability models.
Continue the argument
Expected vs Observed Lottery Frequencies: Reading a Table Properly
Learn expected counts, standard deviations and selection effects so a lottery frequency table describes data without pretending to predict the future.
Why Lottery Backtesting Can Fool You
Spot overfitting, test-set reuse and future leakage, and learn what a fair prospective evaluation of a lottery selection rule would require.
Can AI Predict Lottery Numbers? What a Model Would Need to Learn
Why machine learning cannot extract a predictive signal from independent fair draws, and how to evaluate extraordinary prediction claims.