
What happened
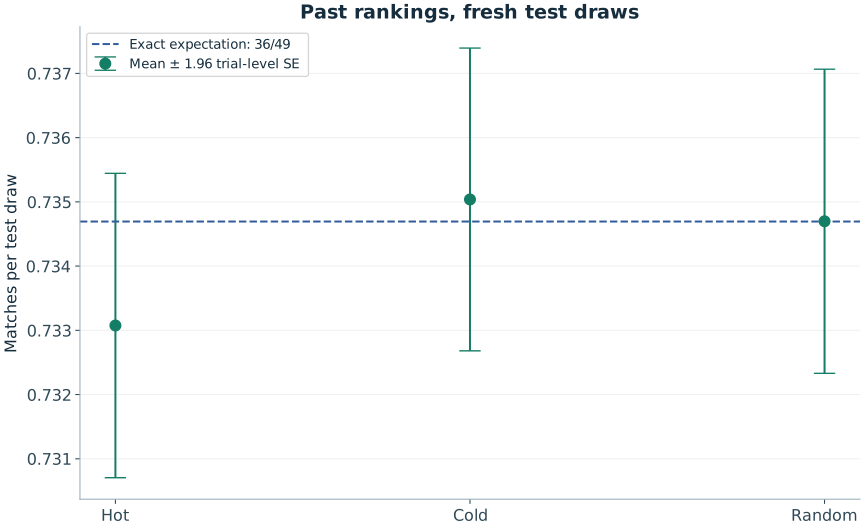
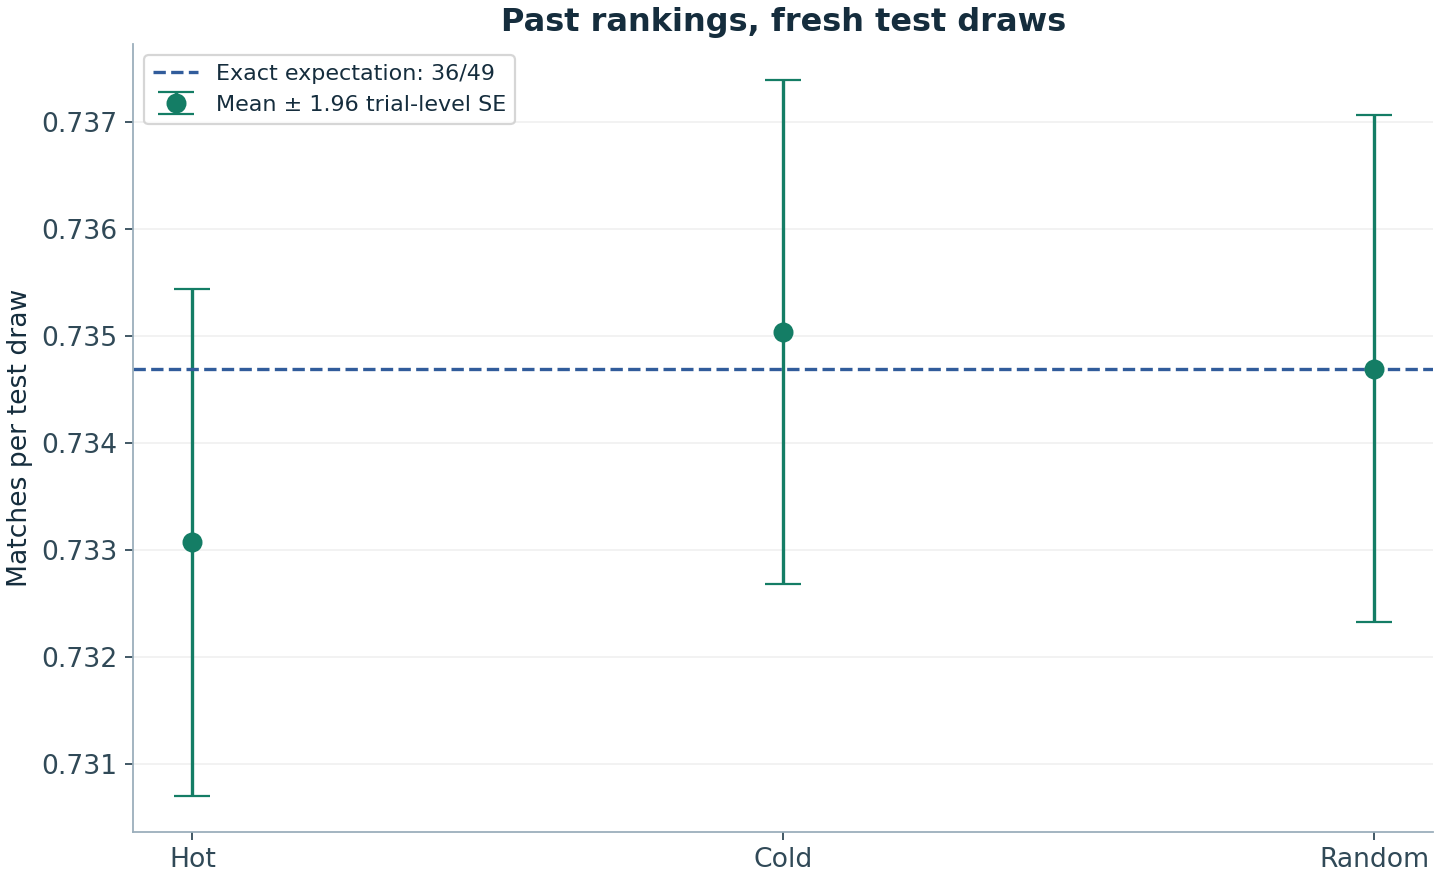
Mean matches per test draw: hot 0.733075; cold 0.7350375; random 0.7346975. The common theoretical expectation is 36/49 ≈ 0.734693878.
The tiny observed ordering is compatible with Monte Carlo variation. It is not evidence for choosing the cold set simply because it came first in this run. All three choices are evaluated against fresh uniform draws, so their conditional expected match count is the same.
Method and benchmark
In each independent trial, rank 49 numbers in 100 training draws, break frequency ties randomly, then freeze three six-number sets and evaluate on 20 fresh draws. Trial-level standard errors account for reuse of each selected set within its test block.
Each independent trial includes 100 training draws, random tie-breaking, three frozen six-label sets and 20 new test draws. Reported standard errors use the 20,000 trial-level mean scores. The methods share each trial’s test data, so comparisons between methods are paired; the marginal error bars are not a standalone significance test of their differences.
Python 3.12.14 · NumPy 2.3.5 · NumPy PCG64 · seed 20260924. Each experiment starts a separate stream. Code and all datasets are linked below.
What this does not establish
Synthetic data only. Comparing means is not a universal proof against every possible strategy; conditional independence gives the theoretical result. The reported uncertainty is Monte Carlo uncertainty, not an audit of a real draw.
The CSV contains one row per independent trial with the three mean scores. This supports a reader’s own paired analysis without publishing a misleadingly independent row for every reused label. It is a synthetic model study, not a historical strategy evaluation.
These are original educational simulations prepared for RoomForChance. They are not historical lottery records, a physical-machine audit, an external peer review or evidence of a prediction advantage.
Inspect the data
Download hot-cold-holdout.csv · All results and metadata (JSON) · Download the complete Python program · Download figure-generation code
The downloadable dataset has 20,000 trial rows. The figure shows their mean scores with marginal uncertainty; the full table is provided as CSV so the paired trial structure is retained.
Reproduce the experiment
Download the Python program to an empty working folder. Use the recorded environment for an exact replay. The program runs all eleven studies and creates a lab-data folder containing the result files. The largest study performs ten million draws; allow time for it to finish.
python -m pip install numpy==2.3.5
python run_experiments.py
Expected CSV SHA-256: ed03a4edafb2a02bf832b392a8410373db15011502ab6933256d803722d77e70. A matching seed alone is insufficient if you change the implementation or call sequence. The CSV files use CC BY 4.0; the original code uses the MIT license included with the downloads.
Read the reasoning
Can AI Predict Lottery Numbers? What a Model Would Need to Learn
Why machine learning cannot extract a predictive signal from independent fair draws, and how to evaluate extraordinary prediction claims.
Why Lottery Backtesting Can Fool You
Spot overfitting, test-set reuse and future leakage, and learn what a fair prospective evaluation of a lottery selection rule would require.
Do Hot and Cold Lottery Numbers Work? A Holdout Test
Examine hot and cold selection rules using conditional probability and an original experiment with separate training and test draws.
The Hot Hand and Lottery Numbers: Do Not Confuse Different Mechanisms
Why evidence about human sporting streaks cannot be transferred to independent lottery draws, and how selection bias complicates streak analysis.
Independent Events: Why a Fair Draw Has No Memory
Learn conditional probability with coins and lottery draws, including why balls within one draw are dependent while separate draws can be independent.
Lotto America Odds: How 5/52 + 1/10 Produces 25,989,600 Outcomes
Derive Lotto America’s jackpot matrix, separate the Star Ball from a multiplier and compare exact match events correctly.
Technical references
NumPy PCG64 documentation describes the generator family. Harvard Stat 110 provides university-level probability background. The model-specific derivation is linked above.