
A million trials can be ample for estimating a probability near one half and almost useless for estimating a probability near one in a hundred million. Simulation precision depends on the event probability as well as the trial count. The headline number of repetitions is not enough.
The central question is how many successes the experiment is expected to observe.
Common events are comparatively easy For N independent Bernoulli trials with event probability p, the estimated proportion has standard deviation √[p(1−p)/N]. At p = 0.5 and N = 1,000,000, this is 0.0005, or 0.05 percentage points.
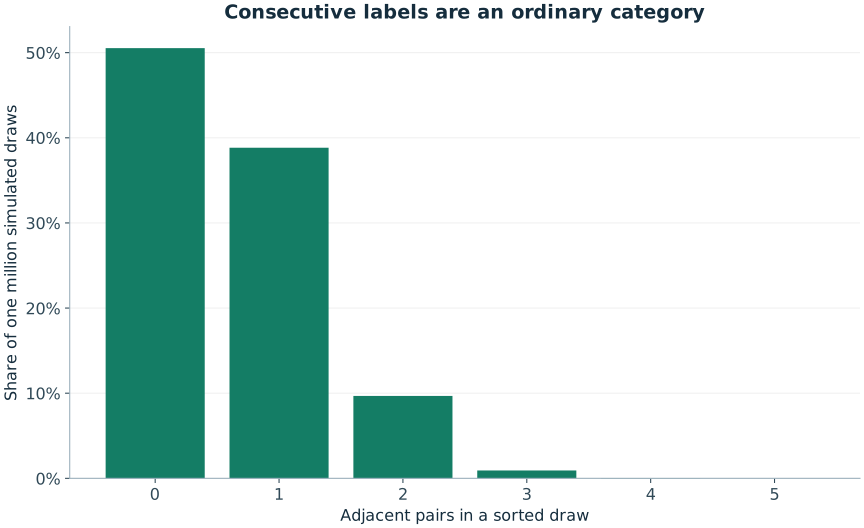
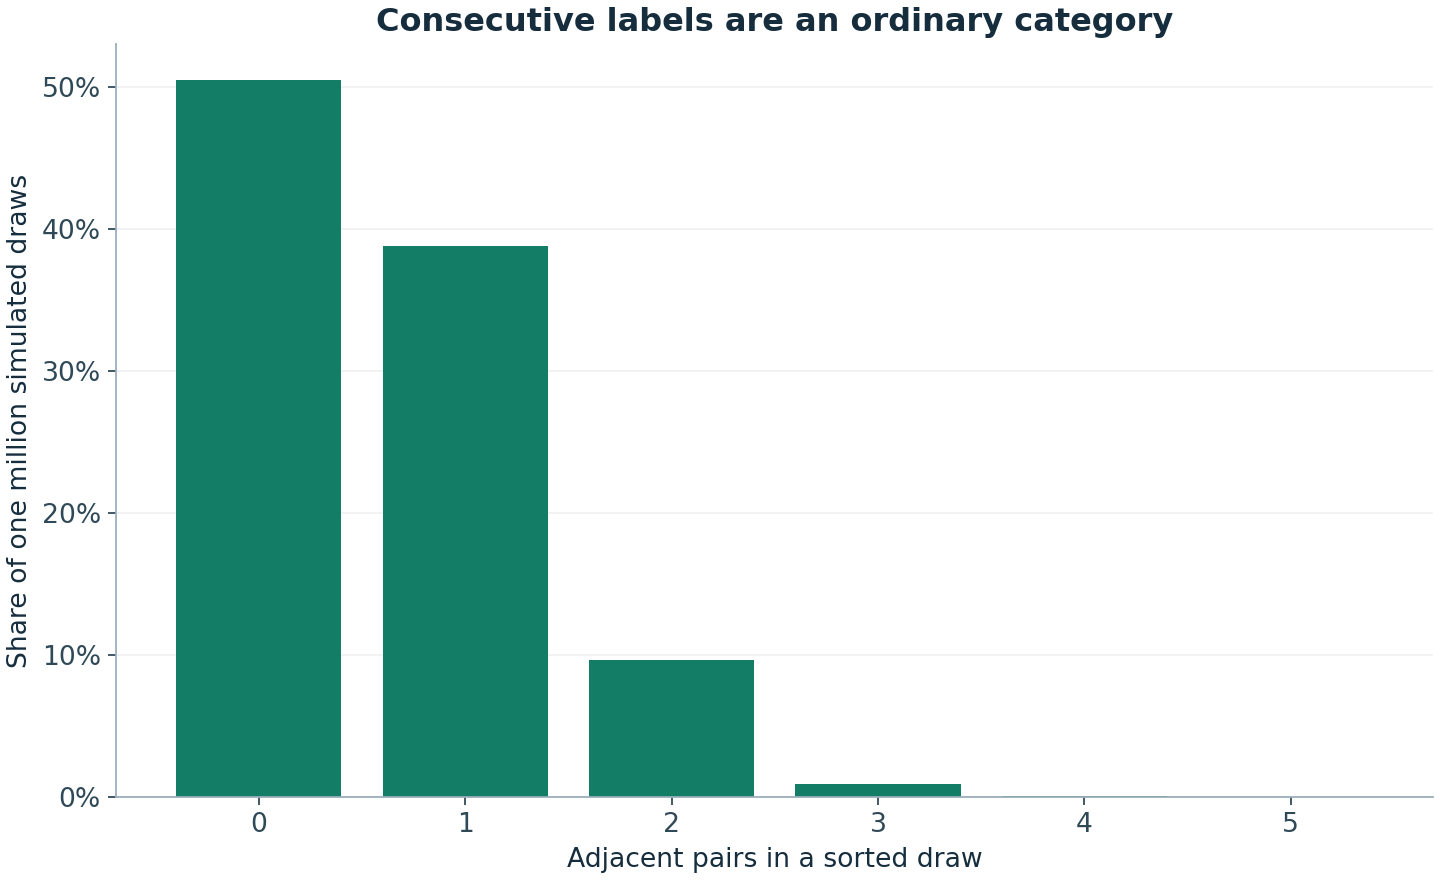
That is a useful scale for a consecutive-pair probability near one half. Observed fractions can differ in the third or fourth decimal place without indicating a defective generator.
Rare events have large relative uncertainty For small p, the standard error is approximately √(p/N). Dividing by p gives relative standard error about 1/√(Np). To reduce relative error, you need many expected successes Np, not simply a large-sounding N.
For one specified 6/49 combination, p = 1/13,983,816. One million trials have expected successes about 0.0715. Most runs therefore observe none. This is why our equality demonstration uses a reduced 3/10 model and an exact counting argument rather than pretending a million 6/49 draws settle the question empirically.
Zero observations do not mean zero probability If no successes occur in N independent trials, an exact one-sided 95% upper confidence bound solves (1−p)^N = 0.05. The bound is p = 1−0.05^(1/N), approximately 3/N for large N.
This “rule of three” approximation describes what zero observations can exclude at a chosen confidence level under the model. It does not prove the event impossible and does not establish an exact probability.
More trials do not repair a wrong model If the simulator uses the wrong pool, allows duplicate main labels or leaks test information into selection, running it a billion times produces a more precise answer to the wrong question. Numerical precision and model validity are separate requirements.
The same applies to uncertainty calculations. If observations are dependent, using the independent-trial formula may exaggerate precision. Our hot/cold experiment computes standard errors from independent trial summaries rather than treating every reused selected label as a fresh independent unit.
A useful reporting format State the event, the trial unit, the sample size, the observed estimate, an appropriate uncertainty measure and any exact reference value. If a confidence interval is approximate, say so. If the result is based on synthetic data, say that too.
The figures in this collection separate model curves from simulated points. Their captions identify which is which. That makes small disagreements informative rather than embarrassing: the variation is part of what a Monte Carlo experiment is designed to reveal, and its scale can be calculated before the first trial is run.
Leave the selection to chance
If you want a valid random game line, open the relevant generator. A generated line is not an official entry or a prediction, and it does not improve the probability of a specified valid combination.
Sources and further reading
The worked examples and derivations are RoomForChance explanations. Operator sources establish game parameters; research sources support the specific points identified above. University links are references, not endorsements.
- Joe Blitzstein and Jessica Hwang · Harvard Stat 110 / Introduction to ProbabilityUniversity-level further reading on counting, conditioning and probability models.
Continue the argument
Monte Carlo Simulation: Learn Probability by Repeating the Model
Build a trustworthy probability simulation with a defined event, reproducible generator, uncertainty estimate and exact benchmark where available.
Why Rare Events Happen: Probability Needs an Opportunity Count
Learn the difference between one rare event, at least one occurrence and a surprise found after searching many opportunities.
Expected vs Observed Lottery Frequencies: Reading a Table Properly
Learn expected counts, standard deviations and selection effects so a lottery frequency table describes data without pretending to predict the future.