
A Monte Carlo simulation estimates properties of a model by repeatedly sampling from it. To estimate a probability, define an event, simulate many trials and divide the number of successes by the number of trials. The procedure can make abstract probability visible, but it only answers the question encoded in the model.
Simulating a fair lottery is not the same thing as predicting an actual draw.
Define one trial before writing a loop A trial might be one complete 6/49 draw, a pair of independent draws, or a 100-draw training block followed by a 20-draw test block. These units have different dependence structures. Counting every ball or every overlapping window as a separate independent trial can understate uncertainty.
For a consecutive-pair experiment, one trial is a complete uniformly sampled six-label set. Success means at least one adjacent difference equals one after sorting. That definition is precise enough for another reader to implement independently.
Estimate and quantify uncertainty If N independent trials produce S successes, the estimate is p-hat = S/N. Away from extreme probabilities and with adequate counts, an approximate standard error is √[p-hat(1−p-hat)/N]. Confidence procedures need extra care near zero or one and when trials are dependent.
A simulation output with six decimal places does not necessarily have six reliable decimal places. The number of trials and event rarity determine the Monte Carlo uncertainty.
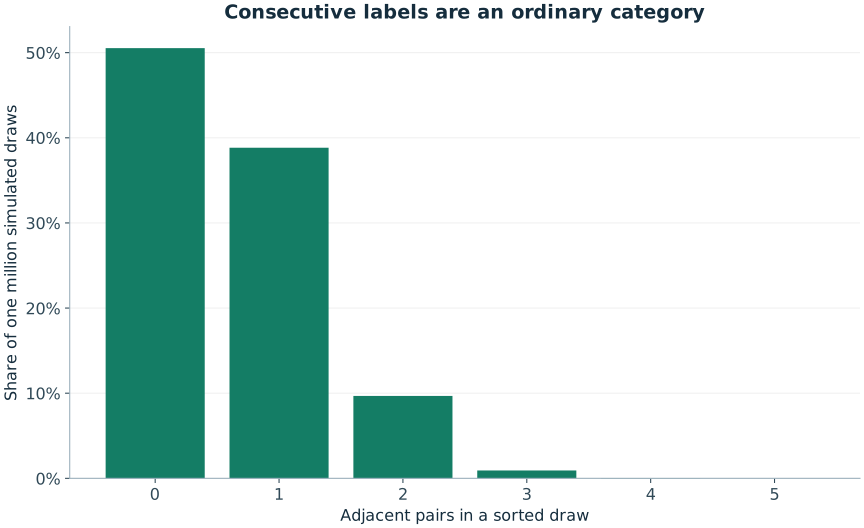
Check against something exact For at least one consecutive pair in a k-of-n draw, the exact probability is 1−C(n−k+1,k)/C(n,k). That gives a strong benchmark for the simulation. A result that differs slightly can be ordinary sampling variation; a systematic discrepancy across large independent runs may reveal a coding error.
Also check invariants: each line has k distinct labels in range, category counts sum to N, and observed totals respect the fixed number of selections. These checks target meaningful failure modes rather than merely repeating the implementation.
Record the full method Publish the seed, generator, environment, parameters and code. State which data are raw and which are aggregates. A compact CSV of category counts can be sufficient to inspect a published figure, while a seed and program allow the original trials to be recreated.
The Lab uses a named seeded PRNG for reproducibility. It does not call those streams “truly random” or suggest that the seed has predictive value.
Know when simulation is the wrong tool An exact combination count is usually better for a jackpot probability. A million trials gives very little information about a one-in-hundreds-of-millions event. A smaller model can illustrate the logic more effectively, provided it is clearly labelled as a smaller model.
The browser simulator focuses on common measurable properties such as adjacency and mean sums. The published experiments handle larger runs and retain their results. Both help explore consequences of assumptions; neither turns those assumptions into evidence that a future lottery result can be forecast.
Leave the selection to chance
If you want a valid random game line, open the relevant generator. A generated line is not an official entry or a prediction, and it does not improve the probability of a specified valid combination.
Sources and further reading
The worked examples and derivations are RoomForChance explanations. Operator sources establish game parameters; research sources support the specific points identified above. University links are references, not endorsements.
- Joe Blitzstein and Jessica Hwang · Harvard Stat 110 / Introduction to ProbabilityUniversity-level further reading on counting, conditioning and probability models.
Continue the argument
Monte Carlo Error: Why a Million Trials Can Still Be Too Few
Estimate simulation precision, understand zero observed successes and distinguish absolute error from relative error for rare events.
What Is a Random Seed? Reproducing an Experiment Correctly
A random seed is only part of a reproducible simulation. Learn why the algorithm, versions and sequence of calls must also be recorded.
Why Lottery Backtesting Can Fool You
Spot overfitting, test-set reuse and future leakage, and learn what a fair prospective evaluation of a lottery selection rule would require.