
What happened
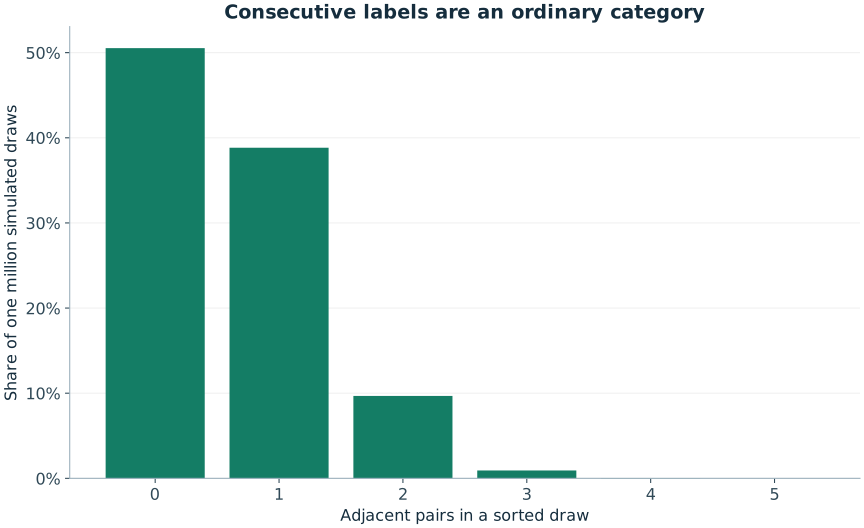
A consecutive pair appeared in 49.4678% of one million draws. The exact probability is 1−C(44,6)/C(49,6) ≈ 49.51984494%.
Nearly half the draws belong to this broad category. The category is common because it contains many valid sets; a particular line inside it still has the same probability as any other specified line.
Method and benchmark
Count adjacent differences equal to one in each sorted 6/49 draw. A run of three contributes two adjacent pairs. Compare the fraction with at least one pair to 1 − C(44,6)/C(49,6).
The program sorts each six-label set and counts differences equal to one. A run of three contributes two pairs. The event “at least one pair” is recorded once per draw, preventing a long run from being counted as several successful draws.
Python 3.12.14 · NumPy 2.3.5 · NumPy PCG64 · seed 20260927. Each experiment starts a separate stream. Code and all datasets are linked below.
What this does not establish
Pairs within a draw are not independent. This is not a count of separate maximal consecutive runs, and a likely category does not improve any individual combination.
The standard error for an event probability near one half with a million independent trials is about 0.0005, or 0.05 percentage points. The observed discrepancy is of the expected Monte Carlo scale. The full CSV retains all adjacent-pair counts, from zero through five.
These are original educational simulations prepared for RoomForChance. They are not historical lottery records, a physical-machine audit, an external peer review or evidence of a prediction advantage.
Inspect the data
Download consecutive-pairs.csv · All results and metadata (JSON) · Download the complete Python program · Download figure-generation code
| adjacent pairs | observed |
|---|---|
| 0 | 505,322 |
| 1 | 388,311 |
| 2 | 96,777 |
| 3 | 9,248 |
| 4 | 340 |
| 5 | 2 |
Reproduce the experiment
Download the Python program to an empty working folder. Use the recorded environment for an exact replay. The program runs all eleven studies and creates a lab-data folder containing the result files. The largest study performs ten million draws; allow time for it to finish.
python -m pip install numpy==2.3.5
python run_experiments.py
Expected CSV SHA-256: 00868f20712696a622e4c30ce9359217e8824936a2befbca91dcfca06a134770. A matching seed alone is insufficient if you change the implementation or call sequence. The CSV files use CC BY 4.0; the original code uses the MIT license included with the downloads.
Read the reasoning
How Likely Are Consecutive Lottery Numbers? An Exact Formula
Derive the probability of at least one consecutive pair in a k-of-n draw and see why it is nearly half for a 6/49 lottery.
Monte Carlo Simulation: Learn Probability by Repeating the Model
Build a trustworthy probability simulation with a defined event, reproducible generator, uncertainty estimate and exact benchmark where available.
Monte Carlo Error: Why a Million Trials Can Still Be Too Few
Estimate simulation precision, understand zero observed successes and distinguish absolute error from relative error for rare events.
Three Consecutive Lottery Numbers: Why Pair Counting Is Not Enough
Calculate a specified triple, distinguish expected triple counts from occurrence probability, and avoid double-counting overlapping runs.
Technical references
NumPy PCG64 documentation describes the generator family. Harvard Stat 110 provides university-level probability background. The model-specific derivation is linked above.