
A sequence does not come with a visible certificate of randomness. The strings HHHHHH and HTTHTH both have probability 1/64 under six independent fair coin tosses. One is easier to describe, but ease of description is not the same thing as the probability assigned by this particular model.
That observation does not mean every diagnostic is useless. It means we must distinguish the probability of one exact string from the probability of a class of strings, and distinguish an observed string from the process that generated it.
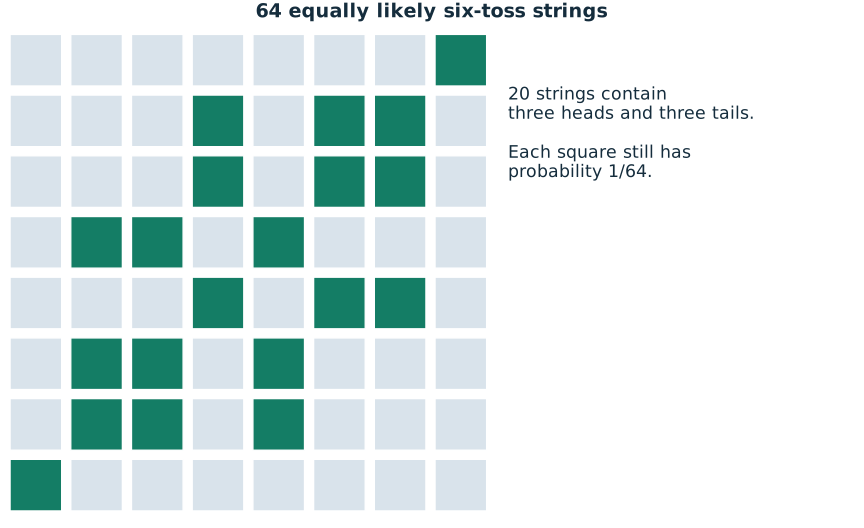
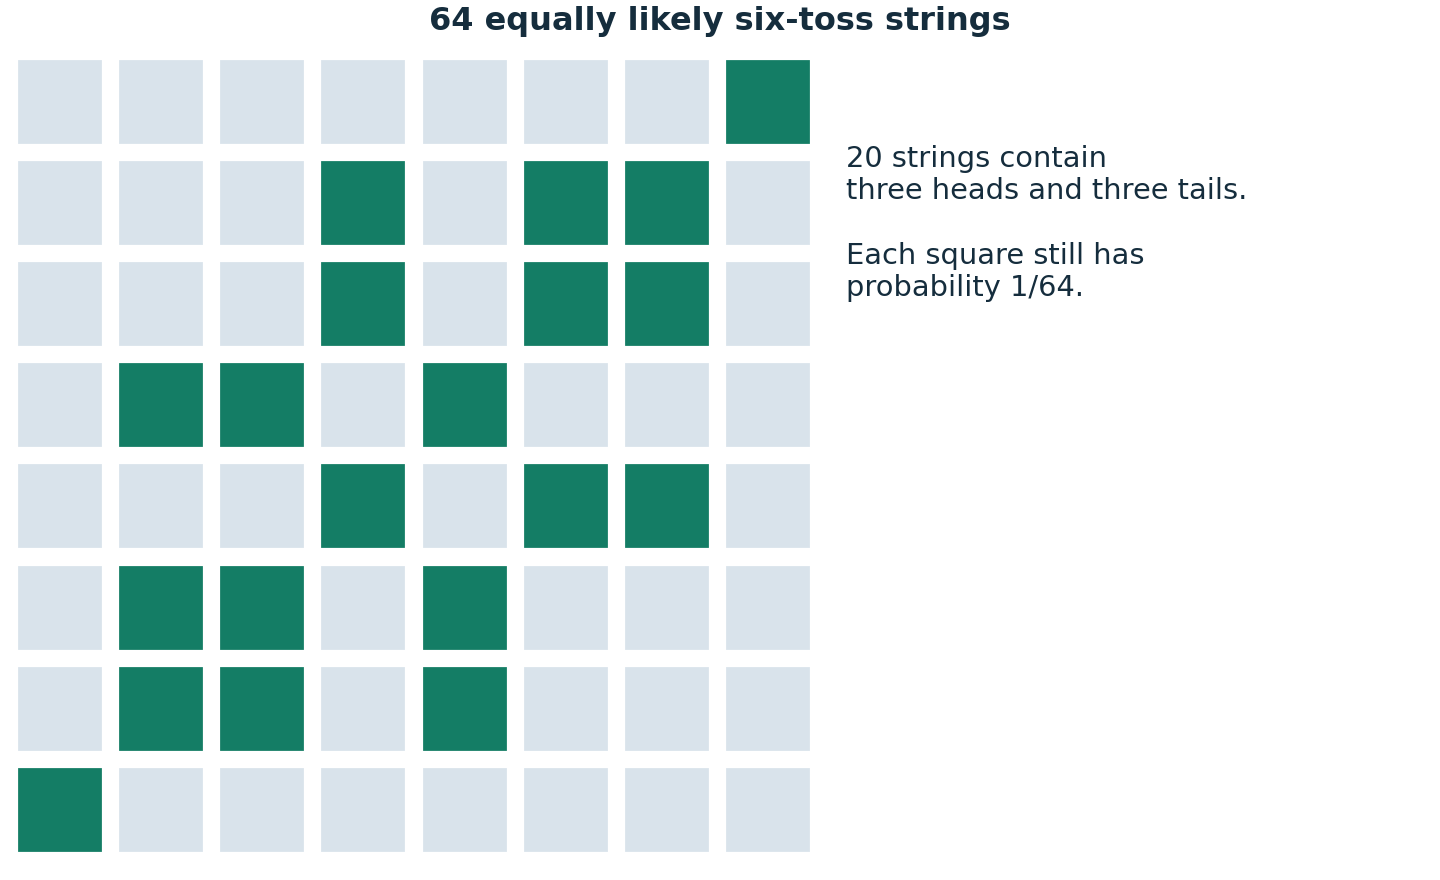
An exact string versus a broad description “Three heads and three tails” describes 20 different six-toss strings, giving probability 20/64. “All heads” describes one. The balanced category is more likely, while each exact member of that category remains no more likely than HHHHHH. This is the same distinction that appears when people compare an all-odd lottery line with a particular mixed line.
A string that changes symbol on every toss looks busy, yet strict alternation is also a strong pattern. A person trying to imitate chance may avoid repeated symbols so consistently that their sequence contains more switching than an independent coin would usually generate.
Count runs, then interpret carefully A run is a maximal block of identical symbols. HHTHH has three runs: HH, T, HH. With N independent fair tosses, there are N−1 boundaries, and each boundary changes symbol with probability one half. By adding those expected changes, the expected number of runs is 1 + (N−1)/2.
For 20 tosses, that is 10.5 runs. An individual sequence must have an integer number, and it can be above or below the expectation. Expectation is not a quota. Our coin tool lets you enter a sequence and compare its run count with that baseline; it does not label a short string “proved random” or “proved fake”.
Sorting changes what you are looking at Lottery results are commonly displayed in ascending order. In that display, the first number is necessarily the minimum. It is not uniformly distributed over 1–49. The last displayed number is the maximum, and it is not distributed like the minimum. Treating sorted positions as if they were independent extraction positions invents patterns that come from presentation.
For six numbers selected uniformly from 1–49, the expected minimum is 50/7 and the expected maximum is 300/7. The tendency for the leftmost number to be small is not evidence of a machine favouring small numbers early; it is a consequence of sorting.
What to ask when a result looks wrong First identify the representation: raw extraction order, sorted set, or selected visualisation. Next define the pattern precisely. Finally calculate how often that pattern should occur under an explicit model, allowing for the fact that you may have searched for many possible patterns.
A random-looking line is useful if it saves you the effort of choosing. It has no mathematical privilege in a uniform draw. Our reduced-lottery experiment makes the distinction visible by enumerating every possible set before comparing the counts of an orderly combination and an irregular one.
Leave the selection to chance
If you want a valid random game line, open the relevant generator. A generated line is not an official entry or a prediction, and it does not improve the probability of a specified valid combination.
Sources and further reading
The worked examples and derivations are RoomForChance explanations. Operator sources establish game parameters; research sources support the specific points identified above. University links are references, not endorsements.
- Joe Blitzstein and Jessica Hwang · Harvard Stat 110 / Introduction to ProbabilityUniversity-level further reading on counting, conditioning and probability models.
Continue the argument
Is 1-2-3-4-5-6 as Likely as Any Other Lottery Combination?
Yes under a uniform 6/49 model. Understand why a specific ordered-looking line differs from the broad category of all consecutive sets.
Are Balanced Lottery Numbers Better? Odd and Even Categories Explained
Compute odd/even category probabilities while showing why a three-odd three-even line has no individual advantage over an all-odd line.
Can Statistical Tests Prove Lottery Numbers Are Random?
Learn what frequency, runs and goodness-of-fit tests can detect, and why passing tests is not proof of fairness or unpredictability.