
The law of large numbers describes the stabilization of averages under suitable assumptions. For independent fair coin tosses, the observed proportion of heads approaches one half as the sample grows. It does not say that each next toss must help correct an earlier imbalance, or that every longer sample is closer than the previous one.
Those stronger claims are tempting because they sound like fairness. They are not what the theorem says.
Dilution rather than repayment Suppose the first 100 tosses contain 60 heads. The excess above the expectation is ten. If the next 900 tosses contain their expected 450 heads, the total becomes 510 out of 1,000. The proportion is now 51%, even though the earlier excess has not been cancelled.
The next block did not need a tail bias. It only needed ordinary fair behaviour over a larger scale. Additional observations reduce the relative influence of the initial block.
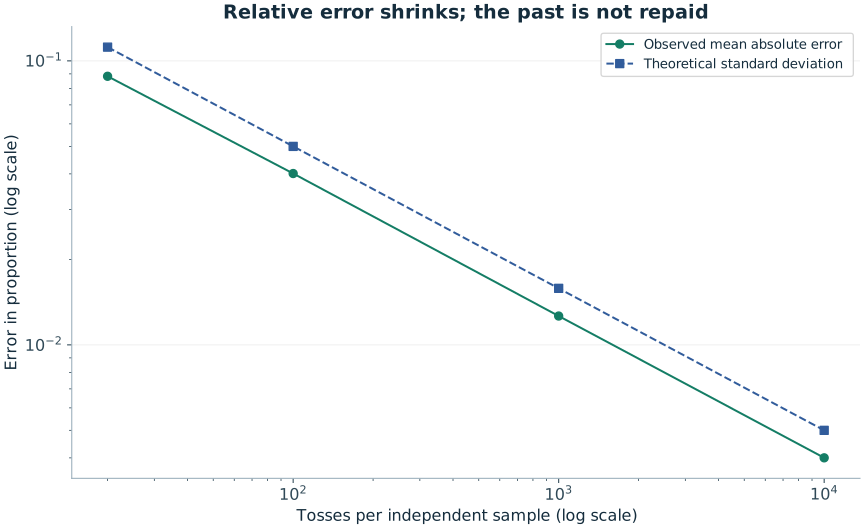
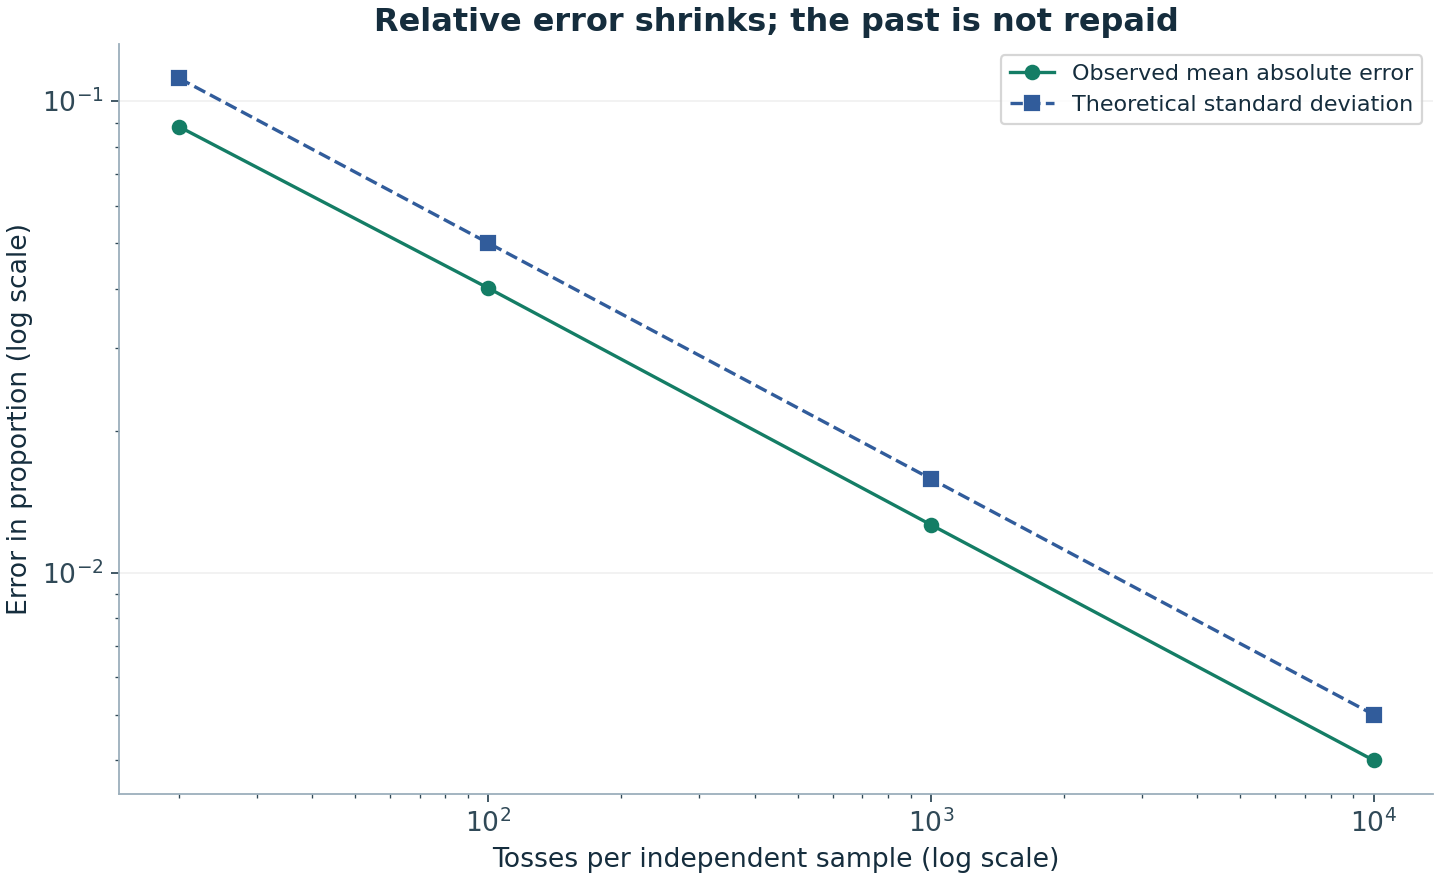
Two error scales move in opposite directions For N fair tosses, the standard deviation of the heads count is √N/2. The standard deviation of the heads proportion is 1/(2√N). The count's typical absolute discrepancy grows; the proportion's typical discrepancy shrinks.
This is why a graph of raw deviations can look more volatile over time while a graph of proportions looks more stable. Neither graph is misleading if its axis and interpretation are clear. Problems arise when a shrinking percentage is described as a forced shrinking count difference.
Convergence is not monotonic A sample proportion can move away from one half on the next toss, even after millions of tosses. The theorem is a long-run statement, not a guarantee about every step. A fair coin does not inspect the current running average before deciding which side should occur.
For a lottery label, the corresponding inclusion proportion approaches k/n under independent uniform k-of-n draws. The same distinction applies: a label below its expected historical count is not assigned a larger next-draw probability to speed up convergence.
The experiment measures different summaries explicitly Our Lab generated 20,000 independent binomial samples at each of four sizes: 20, 100, 1,000 and 10,000 tosses. It reports mean absolute count error, mean absolute proportion error and theoretical standard deviations in separate columns.
Mean absolute deviation and standard deviation are different measures. Their curves need not coincide. The plotted decline shows a scale relationship across repeated experiments, not a promise that a single continuing sequence improves smoothly.
Where the assumptions matter Dependence, changing probabilities or selection of favourable sample endpoints can change the conclusion. If a person stops observing only when the graph looks balanced, the final sample is selected by that stopping rule. If the coin's mechanism changes, one fixed p may no longer describe the entire record.
Use the theorem as a guide to what averages can do under a specified model. Do not turn it into an argument that a losing streak is almost over. Stabilization over many observations and the probability of the next independent observation are related concepts, but they answer different questions.
Leave the selection to chance
If you want a valid random game line, open the relevant generator. A generated line is not an official entry or a prediction, and it does not improve the probability of a specified valid combination.
Sources and further reading
The worked examples and derivations are RoomForChance explanations. Operator sources establish game parameters; research sources support the specific points identified above. University links are references, not endorsements.
- Joe Blitzstein and Jessica Hwang · Harvard Stat 110 / Introduction to ProbabilityUniversity-level further reading on counting, conditioning and probability models.
Continue the argument
The Gambler’s Fallacy: Why a Number Does Not Become Due
A mathematical explanation of the gambler’s fallacy, separating an unlikely past streak from the unchanged probability of the next independent event.
Random Does Not Mean Even: Why Frequencies Fluctuate
Why fair random numbers form unequal counts, how variation scales with sample size, and why the law of large numbers does not force compensation.
Monte Carlo Error: Why a Million Trials Can Still Be Too Few
Estimate simulation precision, understand zero observed successes and distinguish absolute error from relative error for rare events.