
What happened
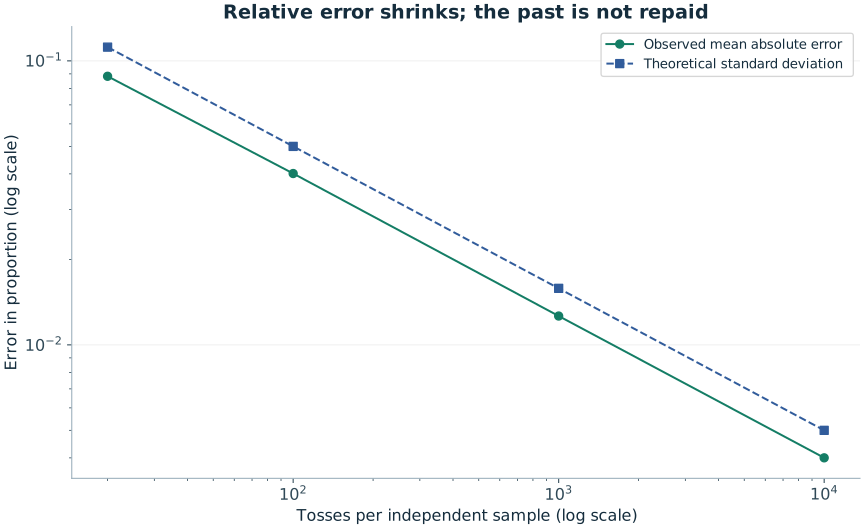
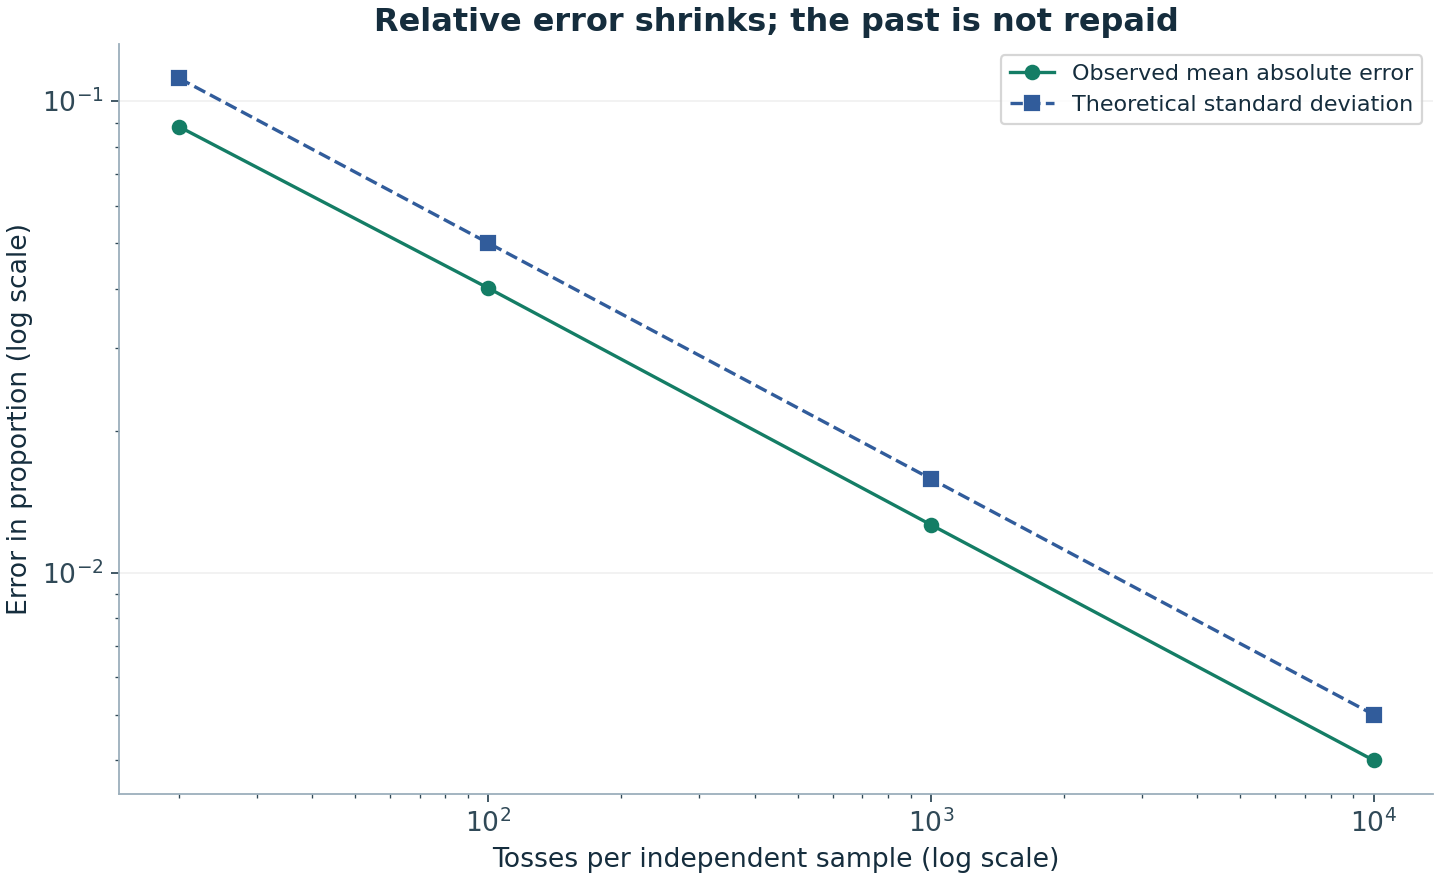
Across 20,000 independent samples at each size, relative error shrank as sample size increased. The CSV reports count and proportion deviations separately.
For fair tosses, the heads count has standard deviation √N/2, while the heads proportion has standard deviation 1/(2√N). More observations can therefore increase typical absolute count error and decrease typical relative error simultaneously.
Method and benchmark
Generate 20,000 independent binomial counts at each sample size. Report mean absolute deviations and theoretical standard deviations separately; they are different summaries.
The observed summaries are mean absolute deviations. The theoretical reference columns are standard deviations. These are different measures of spread, so the plotted curves are not expected to lie exactly on top of one another.
Python 3.12.14 · NumPy 2.3.5 · NumPy PCG64 · seed 20260932. Each experiment starts a separate stream. Code and all datasets are linked below.
What this does not establish
Different sample sizes use independent replicates, not one continuing trajectory. Average relative error shrinks; no individual path is forced to improve at every step.
Samples at each size are independently generated, not nested portions of a single continuing path. The experiment illustrates scaling across repeated samples. It does not show that every next toss improves the running proportion or that the future compensates for a past imbalance.
These are original educational simulations prepared for RoomForChance. They are not historical lottery records, a physical-machine audit, an external peer review or evidence of a prediction advantage.
Inspect the data
Download law-large-numbers.csv · All results and metadata (JSON) · Download the complete Python program · Download figure-generation code
| tosses | mean absolute count error | mean absolute proportion error | count standard deviation | proportion standard deviation |
|---|---|---|---|---|
| 20 | 1.7653 | 0.088265 | 2.23606798 | 0.111803399 |
| 100 | 4.012 | 0.04012 | 5 | 0.05 |
| 1,000 | 12.63405 | 0.01263405 | 15.8113883 | 0.0158113883 |
| 10,000 | 40.0128 | 0.00400128 | 50 | 0.005 |
Reproduce the experiment
Download the Python program to an empty working folder. Use the recorded environment for an exact replay. The program runs all eleven studies and creates a lab-data folder containing the result files. The largest study performs ten million draws; allow time for it to finish.
python -m pip install numpy==2.3.5
python run_experiments.py
Expected CSV SHA-256: 848d08f460183469f29ec9ad040c8e54b8ff7840e71b25cf19f3a1b93d5d2bcf. A matching seed alone is insufficient if you change the implementation or call sequence. The CSV files use CC BY 4.0; the original code uses the MIT license included with the downloads.
Read the reasoning
The Law of Large Numbers Does Not Make a Losing Number Due
See how sample proportions stabilize without future compensation, and why absolute deviations can grow while relative errors shrink.
Random Does Not Mean Even: Why Frequencies Fluctuate
Why fair random numbers form unequal counts, how variation scales with sample size, and why the law of large numbers does not force compensation.
Technical references
NumPy PCG64 documentation describes the generator family. Harvard Stat 110 provides university-level probability background. The model-specific derivation is linked above.