
Choosing a number without a deliberate plan is not the same as sampling uniformly. A person can feel spontaneous while favouring familiar labels, avoiding recent choices or spreading selections across a grid. The useful scientific question is not whether someone feels random, but what distribution their choices produce.
Preferences are measurable Wang, Potter van Loon, van den Assem and van Dolder examined lottery selections and reported systematic number preferences in their data. Their work is a source on human choice behaviour, with the limits that accompany particular games and observed populations. It should not be turned into a universal ranking of lucky labels.
The distinction matters because there are two distributions: the distribution of player selections and the distribution of official outcomes. A preference in the first does not establish a bias in the second.
An avoidance rule can create dependence Imagine choosing a digit from 0–9 but refusing to repeat the previous digit. Every digit could still have a long-run share near one tenth, yet the sequence is not independent. Conditional on the last digit being 7, the next digit cannot be 7.
A simple frequency table might miss that structure. The transition rule reveals it. This is why uniform marginal counts are not enough to establish the quality of a random sequence.
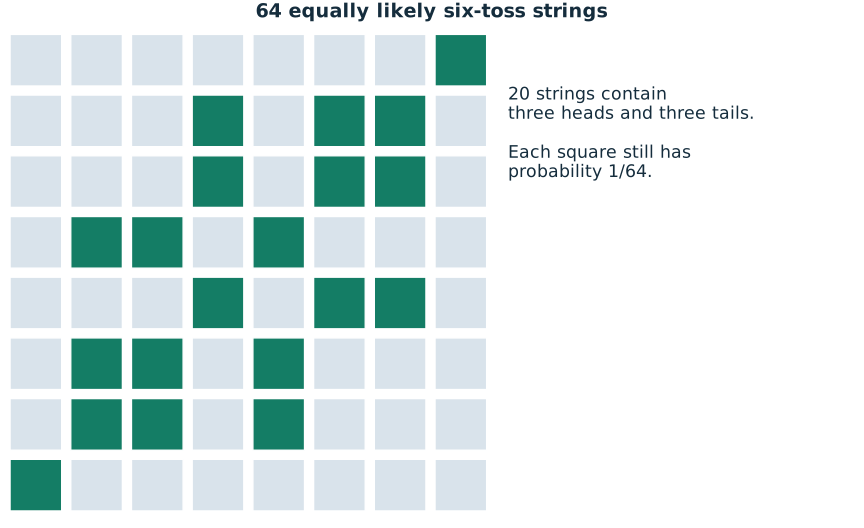
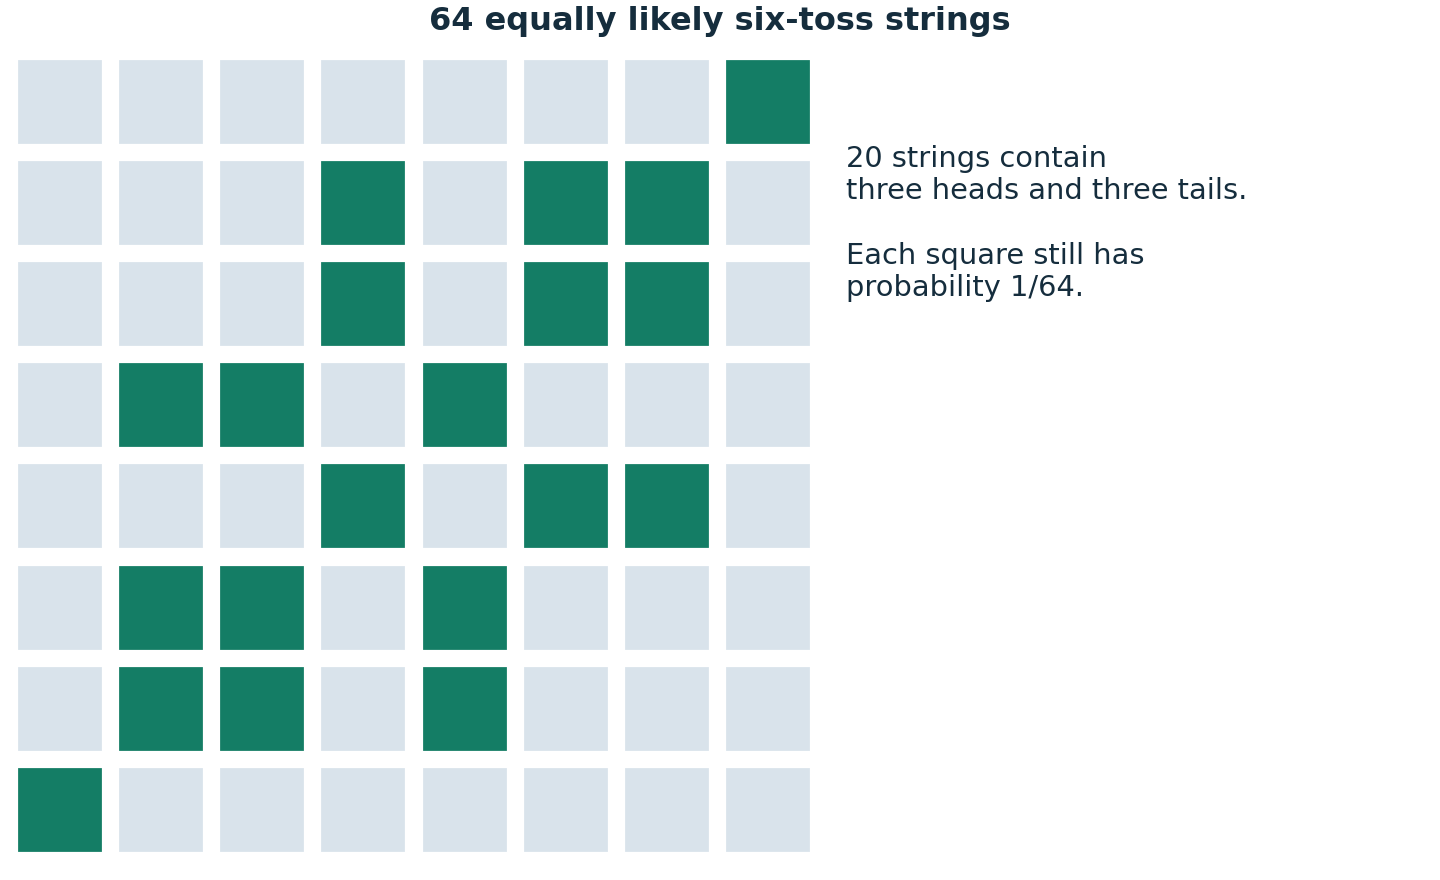
Try the same idea with coins Write 30 H and T symbols as if imitating fair tosses. Count the runs: maximal uninterrupted blocks of one symbol. For 30 independent fair tosses, the expected run count is 1 + 29/2 = 15.5. A sequence with very frequent alternation has more runs; a sequence with long blocks has fewer.
That comparison is educational, not a diagnosis of its author or a conclusive test of randomness. A genuinely random short sequence can be extreme. If many people try many sequences and keep only the most interesting, the selection process matters too.
Aesthetics can narrow a lottery generator A person may repeatedly press Generate until a line has a satisfying spread, no adjacent labels and a balanced odd/even count. The final selection is then conditional on those aesthetic filters. The source may be impartial, but the accepted output is no longer an unrestricted sample from the original space.
This does not make the final line less valid. It means the person has combined random proposals with a preference rule. Under a uniform external draw, the accepted specified line still has the same full-match probability as any other valid line.
What we should not infer A behavioural pattern does not show that people are irrational in every context, nor that one individual follows every population tendency. Personal numbers can have sentimental value unrelated to predictive belief. The error begins when meaning or appearance is treated as evidence that the draw will favour the choice.
The coin tool provides a small, inspectable exercise in sequence structure. The game generators provide a different service: making a valid selection without requiring personal criteria. Both are useful precisely when their claims remain limited to what they actually do.
Leave the selection to chance
If you want a valid random game line, open the relevant generator. A generated line is not an official entry or a prediction, and it does not improve the probability of a specified valid combination.
Sources and further reading
The worked examples and derivations are RoomForChance explanations. Operator sources establish game parameters; research sources support the specific points identified above. University links are references, not endorsements.
- Wang, Potter van Loon, van den Assem & van Dolder (2016) · Number preferences in lotteriesJudgment and Decision Making 11(3), 243–259. Empirical work on selection behaviour; not evidence that chosen numbers influence a fair draw.
- Joe Blitzstein and Jessica Hwang · Harvard Stat 110 / Introduction to ProbabilityUniversity-level further reading on counting, conditioning and probability models.
Continue the argument
What Does a Random Sequence Look Like? The Appearance Trap
Why alternating coins can look more random than genuine samples, and why sorting lottery results changes the patterns you see.
Quick Pick vs Choosing Your Own Numbers: Does Either Have Better Odds?
Compare Quick Pick, Lucky Dip and personal selections while separating draw probability, winner counts and possible prize sharing.
Can Statistical Tests Prove Lottery Numbers Are Random?
Learn what frequency, runs and goodness-of-fit tests can detect, and why passing tests is not proof of fairness or unpredictability.