
A streak can be unlikely at one specified location and unsurprising somewhere in a long record. This is why a headline about five repeated outcomes can mislead even when its arithmetic is technically correct: it may quote the probability of a single preselected window while quietly searching hundreds of windows.
The location of the streak matters For a fair coin, the probability that tosses 1–5 are all heads is 1/32. The probability that those five tosses are all the same—either heads or tails—is 2/32. The probability that a run of five identical results occurs somewhere in 100 tosses is a different calculation again.
There are 96 possible starting positions for a five-toss window in 100 tosses. The expected number of all-heads windows is 96/32 = 3. This does not imply a probability of 3, and it does not imply exactly three separate streaks. A six-head run contains two overlapping five-head windows. Adding expected counts is valid; pretending the overlapping windows are independent is not.
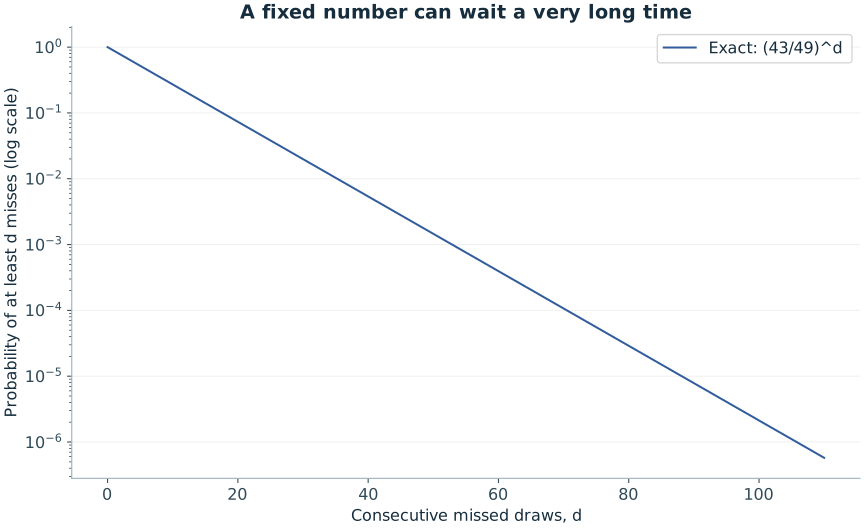
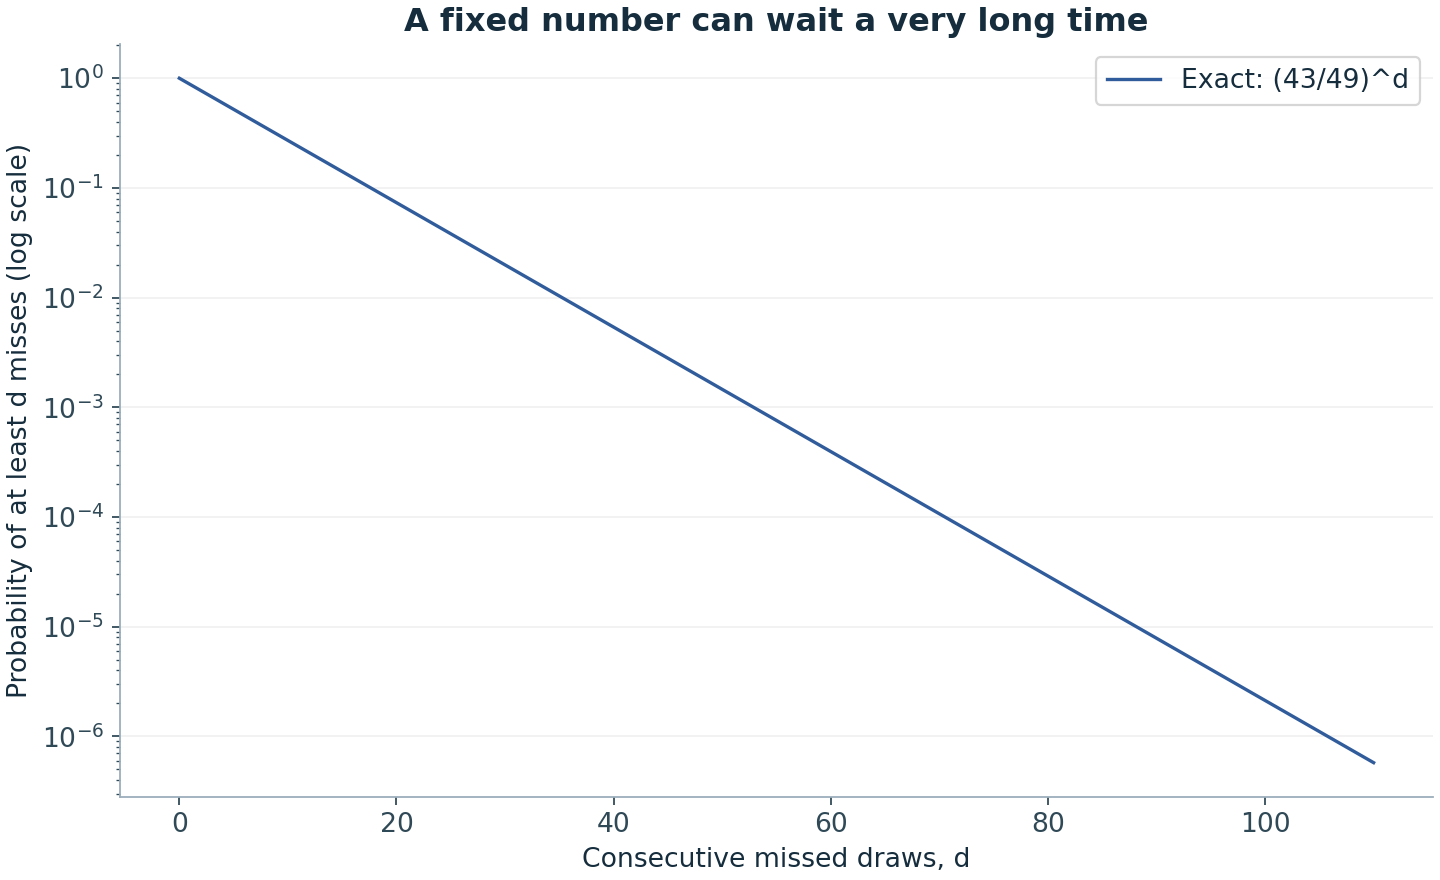
A lottery number can form a streak too For a number identified in advance, the probability of appearing in r consecutive independent 6/49 draws is (6/49)^r. If instead we inspect every number, every possible starting date and several possible streak lengths, there are many more opportunities to find a story.
A responsible analysis records the search scope. Was number 17 chosen beforehand? Was a five-draw run the prespecified target? Were these the only dates inspected? Answers to these questions can matter more than the number of decimal places in the final probability.
Clusters do not require attraction Suppose raindrops fall independently across a floor. Some small squares receive several drops and some none. Uniform coverage would require the drops to coordinate their positions to avoid one another. Independent events have no such coordination, so clumps and gaps are natural outcomes.
Lottery drawings have additional structure because numbers within each draw cannot repeat, but the principle survives between drawings. A label can return quickly, then disappear for a while. Neither phase requires momentum or repayment.
How to study a streak without fooling yourself Define the event before running the calculation: exact symbol, either symbol, at least this length, a specified window, or anywhere in a record. Use a recurrence or simulation that preserves overlapping windows. Record the sample length and report the full distribution, rather than only the most dramatic run.
The coin tool counts runs and the longest run directly from a sequence. The overdue experiment studies complete waits for one specified number, which is a separate question from the longest absence among all numbers. Those design choices prevent superficially similar statistics from being confused.
A striking streak may motivate a closer look at a mechanism, especially if it occurs repeatedly under a prespecified test. It is not enough to declare a fair process impossible. The right comparison is between the observed pattern and the opportunities the process had to produce it.
Leave the selection to chance
If you want a valid random game line, open the relevant generator. A generated line is not an official entry or a prediction, and it does not improve the probability of a specified valid combination.
Sources and further reading
The worked examples and derivations are RoomForChance explanations. Operator sources establish game parameters; research sources support the specific points identified above. University links are references, not endorsements.
- Joe Blitzstein and Jessica Hwang · Harvard Stat 110 / Introduction to ProbabilityUniversity-level further reading on counting, conditioning and probability models.
Continue the argument
The Gambler’s Fallacy: Why a Number Does Not Become Due
A mathematical explanation of the gambler’s fallacy, separating an unlikely past streak from the unchanged probability of the next independent event.
Are Overdue Lottery Numbers More Likely to Be Drawn?
Calculate the probability of long absences, understand geometric waiting times, and distinguish a fixed number from the most overdue number.
Multiple Comparisons: Why Random Data Keeps Producing “Signals”
Calculate how repeated testing creates false alarms and learn why a pattern found after a broad search needs a different interpretation.