
What happened
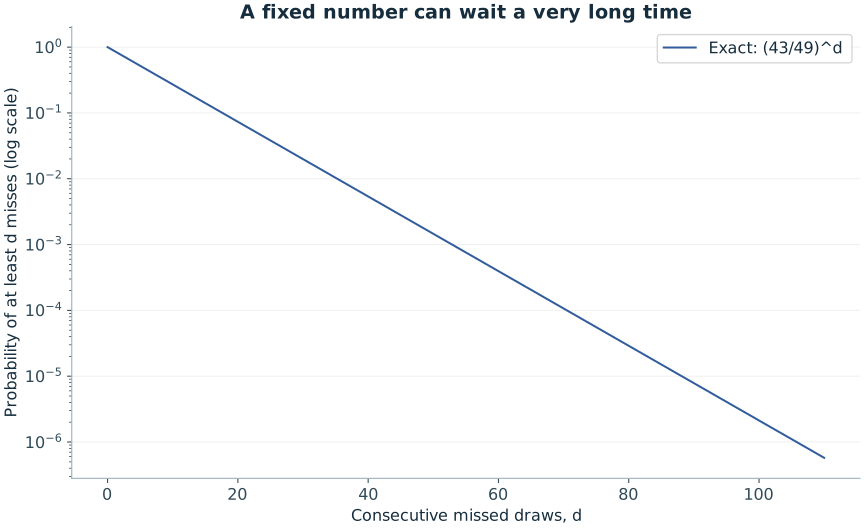
One million complete waits produced a mean of 7.15402 missed draws before success. The theoretical mean is 43/6 ≈ 7.166667. The longest observed wait contained 110 misses.
The longest wait is a selected extreme among one million opportunities. It is not a forecast for the next wait, a maximum allowed by probability, or a statistic for the most overdue label among all 49 labels at a single moment.
Method and benchmark
Draw one million independent geometric waiting times for a prespecified number with inclusion probability 6/49. Subtract one so each observation counts missed draws before success. All waits are complete, avoiding right censoring.
A wait counts misses before the successful draw. The model is geometric with p=6/49, so P(at least d misses)=(43/49)^d. Subtracting one from an inclusive geometric waiting time establishes the stated convention and avoids an off-by-one interpretation.
Python 3.12.14 · NumPy 2.3.5 · NumPy PCG64 · seed 20260926. Each experiment starts a separate stream. Code and all datasets are linked below.
What this does not establish
The longest wait among a million is not a forecast for the next wait. This model describes one fixed number, not the maximum gap over 49 dependent number histories.
Every simulated wait is completed. This avoids the right-censoring problem in a finite historical record, where a still-running absence is not a completed observation. The CSV groups complete waits into declared intervals, and the figure shows the exact survival curve on a logarithmic axis.
These are original educational simulations prepared for RoomForChance. They are not historical lottery records, a physical-machine audit, an external peer review or evidence of a prediction advantage.
Inspect the data
Download overdue-gaps.csv · All results and metadata (JSON) · Download the complete Python program · Download figure-generation code
| minimum misses | maximum misses | observed | expected |
|---|---|---|---|
| 0 | 4 | 480,027 | 479,570.534 |
| 5 | 9 | 249,203 | 249,582.637 |
| 10 | 19 | 197,658 | 197,488.824 |
| 20 | 39 | 67,756 | 67,976.608 |
| 40 | 79 | 5,320 | 5,352.43744 |
| 80 | 999,999 | 36 | 28.9594323 |
Reproduce the experiment
Download the Python program to an empty working folder. Use the recorded environment for an exact replay. The program runs all eleven studies and creates a lab-data folder containing the result files. The largest study performs ten million draws; allow time for it to finish.
python -m pip install numpy==2.3.5
python run_experiments.py
Expected CSV SHA-256: dd59432b7bd70c925fbde92195ffc58309a1994ebe8fccb4bb019879df59ff4b. A matching seed alone is insufficient if you change the implementation or call sequence. The CSV files use CC BY 4.0; the original code uses the MIT license included with the downloads.
Read the reasoning
The Gambler’s Fallacy: Why a Number Does Not Become Due
A mathematical explanation of the gambler’s fallacy, separating an unlikely past streak from the unchanged probability of the next independent event.
Are Overdue Lottery Numbers More Likely to Be Drawn?
Calculate the probability of long absences, understand geometric waiting times, and distinguish a fixed number from the most overdue number.
Why Randomness Creates Streaks, Clusters and Repetitions
Understand random streaks using fixed windows, overlapping opportunities and a clear distinction between a specified run and any run.
Technical references
NumPy PCG64 documentation describes the generator family. Harvard Stat 110 provides university-level probability background. The model-specific derivation is linked above.