
What happened
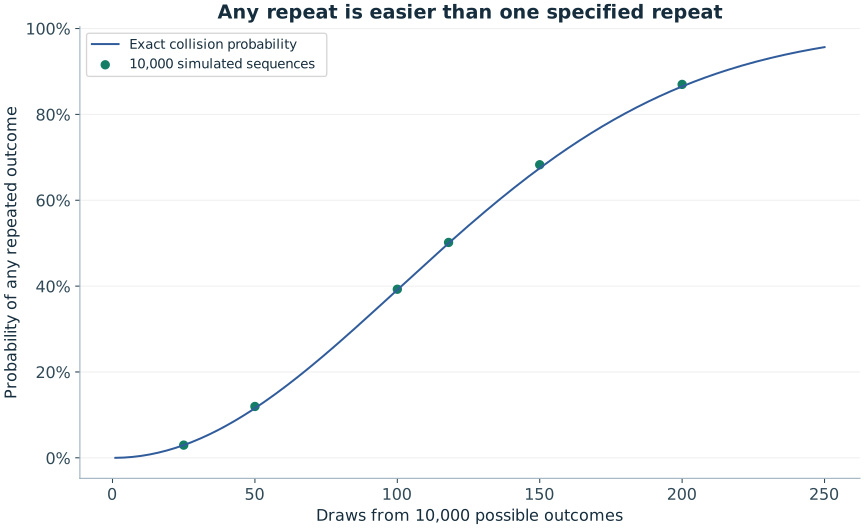
Across 10,000 independent sequences drawn from 10,000 equally likely outcomes, the median first-repeat time was 118 draws.
A repeat can match any earlier outcome. The number of possible matching pairs grows roughly with the square of the sequence length, which explains why the collision scale is near the square root of the number of outcomes.
Method and benchmark
Run 10,000 independent sequences on 10,000 equally likely outcomes, stopping at the first repeated outcome. Calculate exact collision probabilities with the product of (1−j/M).
Each sequence stops at its first collision. The exact probability of a collision by t draws is one minus the product of (1−j/10,000) for j from zero to t−1. The plotted model curve and sampled points are explicitly separate.
Python 3.12.14 · NumPy 2.3.5 · NumPy PCG64 · seed 20260930. Each experiment starts a separate stream. Code and all datasets are linked below.
What this does not establish
The reduced state space makes the birthday effect visible. It is not a claim that a particular real lottery combination repeats after 118 draws.
The reduced space makes collisions observable without pretending to forecast a real lottery. Waiting for one particular prespecified outcome remains a different question with mean waiting time 10,000 in this model. The CSV records collision proportions at prespecified sequence lengths.
These are original educational simulations prepared for RoomForChance. They are not historical lottery records, a physical-machine audit, an external peer review or evidence of a prediction advantage.
Inspect the data
Download birthday-collisions.csv · All results and metadata (JSON) · Download the complete Python program · Download figure-generation code
| draws | observed collision probability | exact probability |
|---|---|---|
| 25 | 0.0296 | 0.0295782712 |
| 50 | 0.1196 | 0.115473342 |
| 100 | 0.3927 | 0.391434035 |
| 118 | 0.5017 | 0.499936241 |
| 150 | 0.6827 | 0.674733645 |
| 200 | 0.8698 | 0.865119639 |
Reproduce the experiment
Download the Python program to an empty working folder. Use the recorded environment for an exact replay. The program runs all eleven studies and creates a lab-data folder containing the result files. The largest study performs ten million draws; allow time for it to finish.
python -m pip install numpy==2.3.5
python run_experiments.py
Expected CSV SHA-256: c3b955f884cf7650b7b5f94d76806ddaed6a9378d1928d0bf1619fbf2786ec17. A matching seed alone is insufficient if you change the implementation or call sequence. The CSV files use CC BY 4.0; the original code uses the MIT license included with the downloads.
Read the reasoning
The Birthday Paradox in Lottery Draws: Any Repeat vs One Repeat
Why any repeated combination becomes plausible much sooner than a chosen combination returning, with exact and approximate collision formulas.
Why Duplicate Lottery Lines Do Not Increase Coverage
Distinguish repeated labels, repeated full lines and repeated entries across draws, and calculate how duplicates reduce distinct outcome coverage.
Do More Lottery Tickets Increase Your Odds? The Exact Mathematics
Compare distinct lines in one draw, duplicate lines and repeated independent draws without confusing relative improvement with a likely win.
Probability vs Odds: What Does “1 in a Million” Mean?
Convert probabilities, percentages and odds against correctly, and learn why one-in-X is not a deadline for a rare event.
Why Rare Events Happen: Probability Needs an Opportunity Count
Learn the difference between one rare event, at least one occurrence and a surprise found after searching many opportunities.
Technical references
NumPy PCG64 documentation describes the generator family. Harvard Stat 110 provides university-level probability background. The model-specific derivation is linked above.